library(ggplot2)
data("diamonds")
ggplot(diamonds, aes(x=clarity, fill=color)) + geom_bar()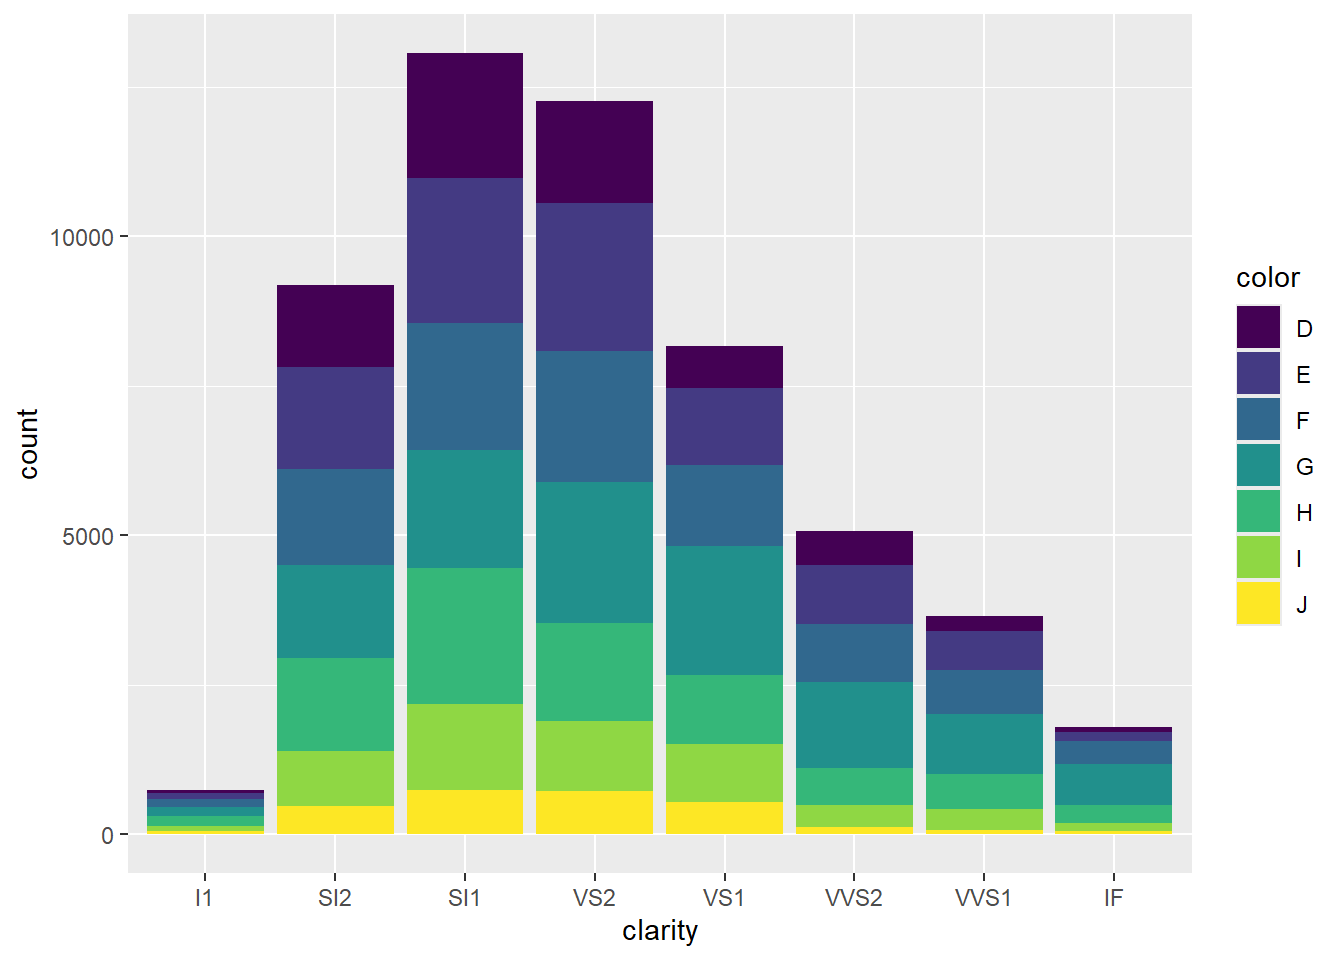
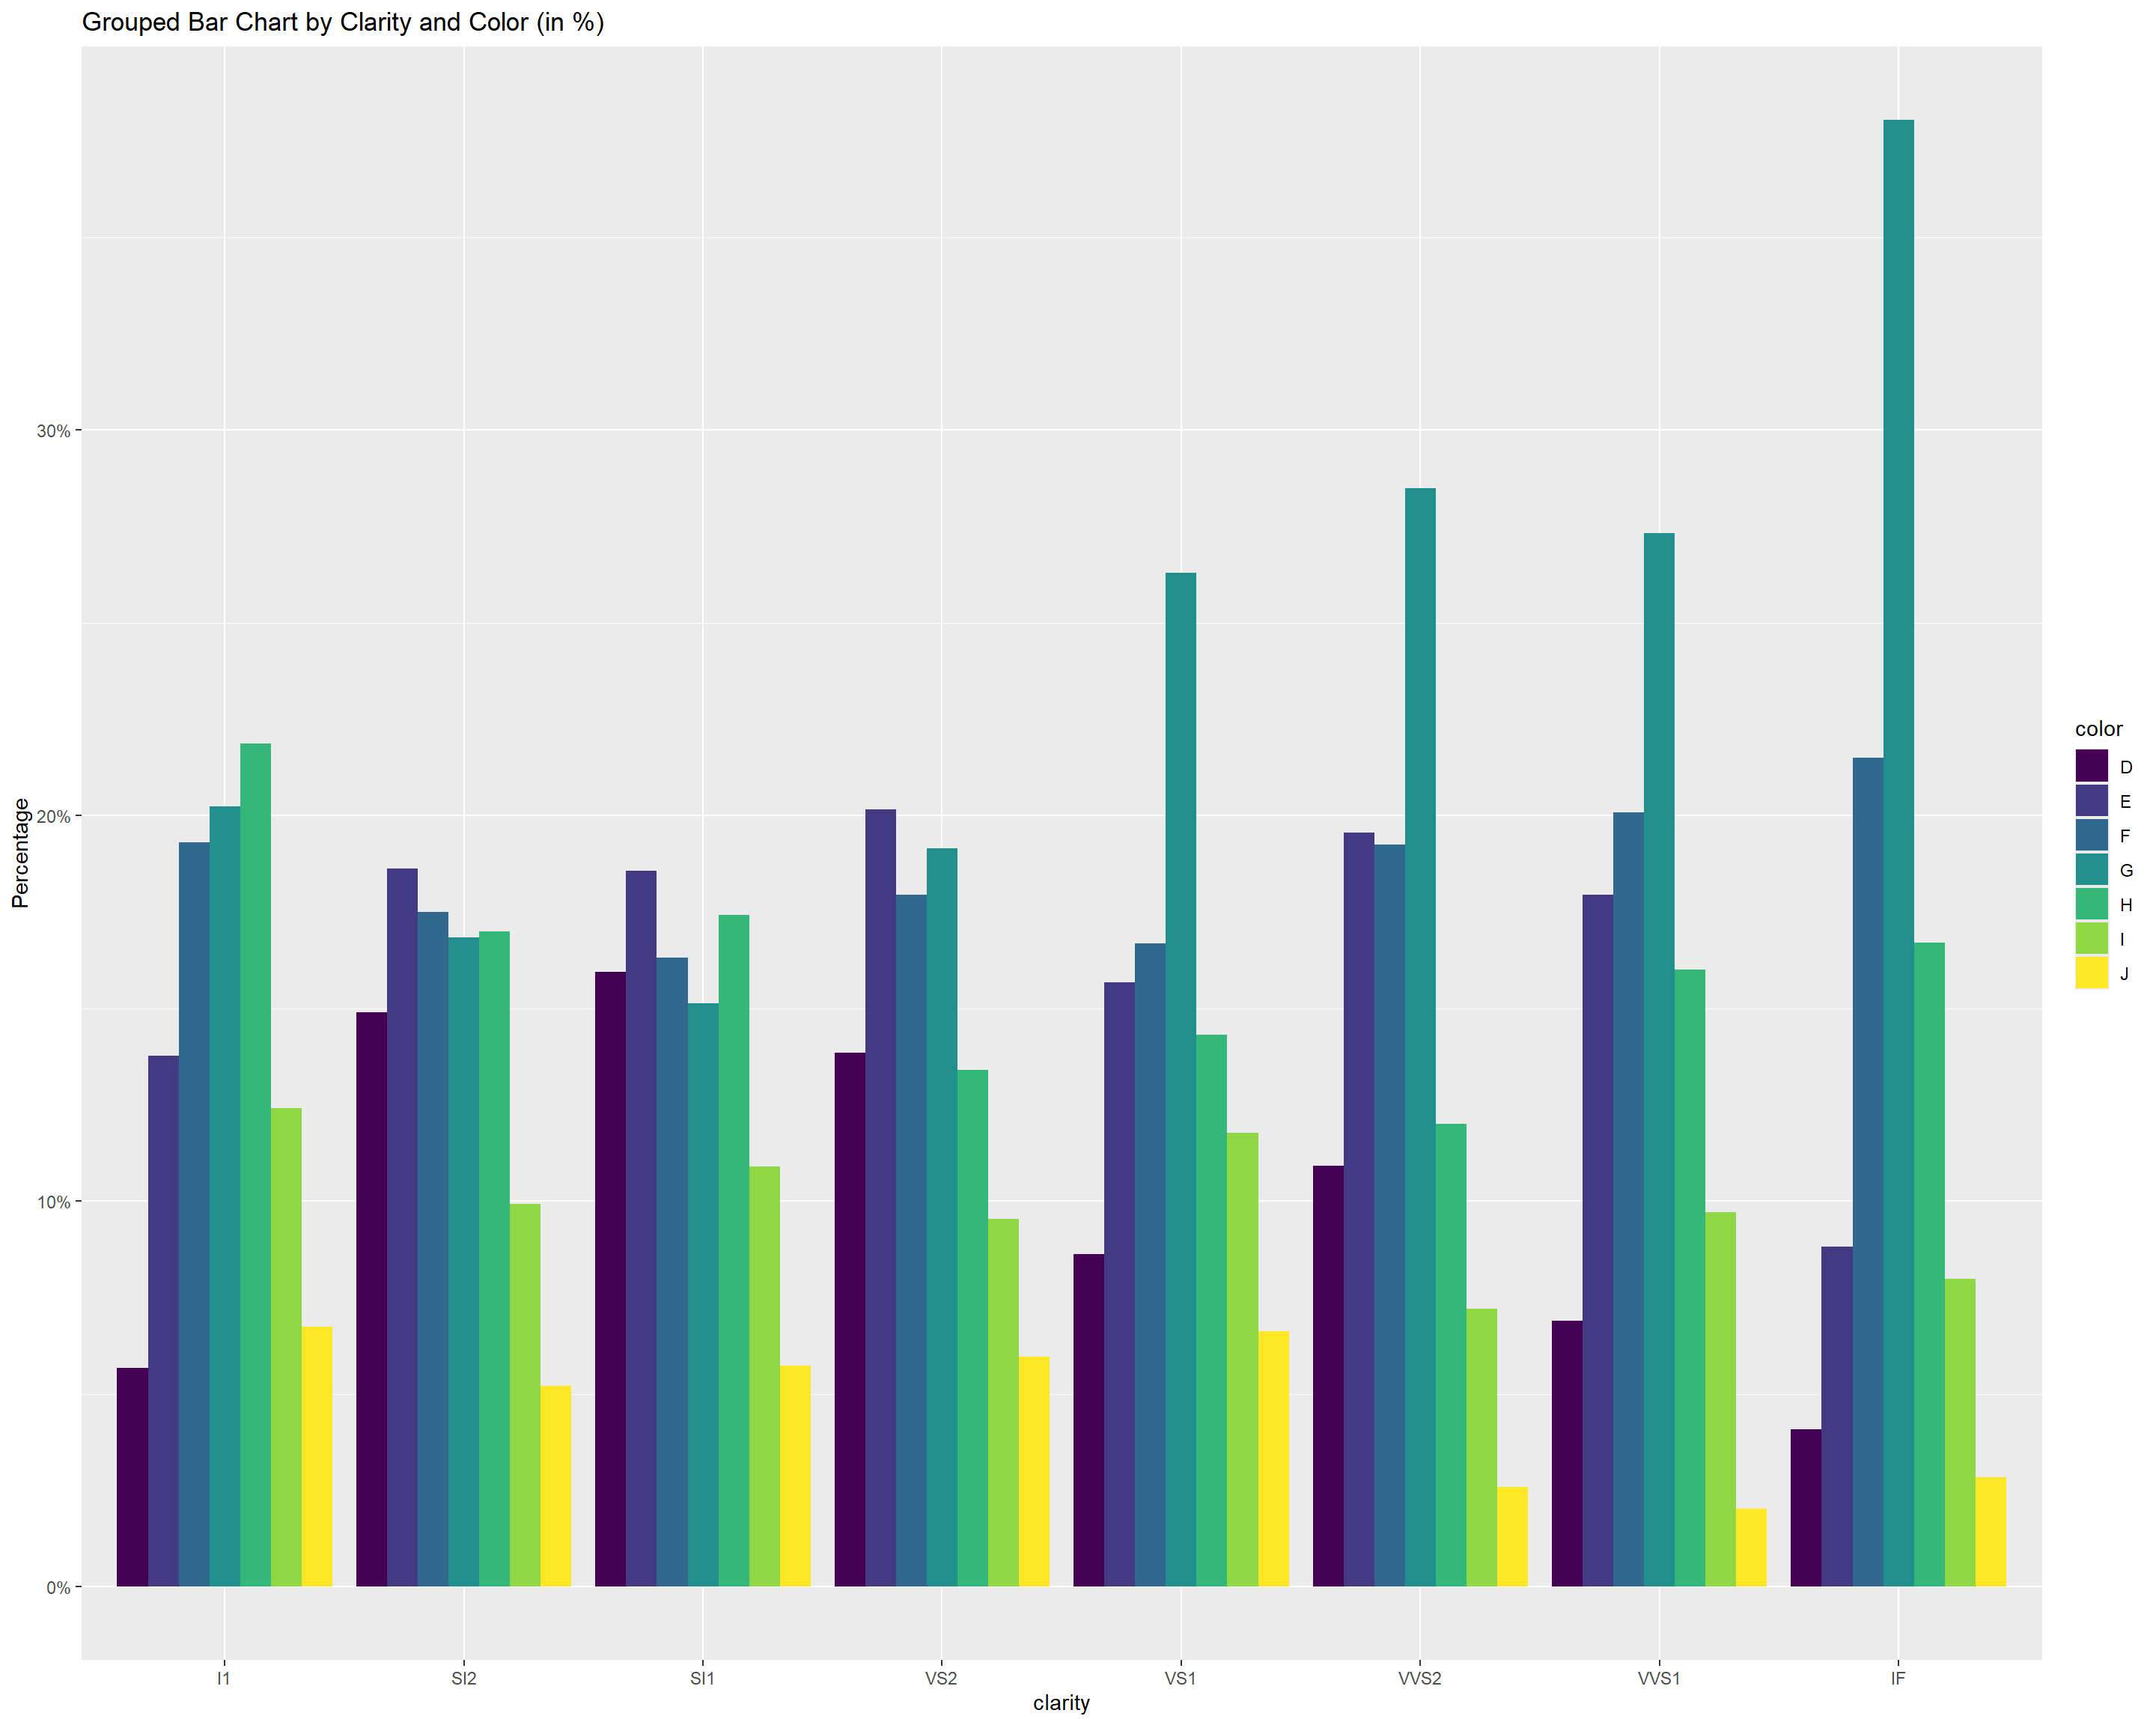
ggplot(diamonds, aes(x=clarity, fill=color)) + geom_bar(position = "dodge")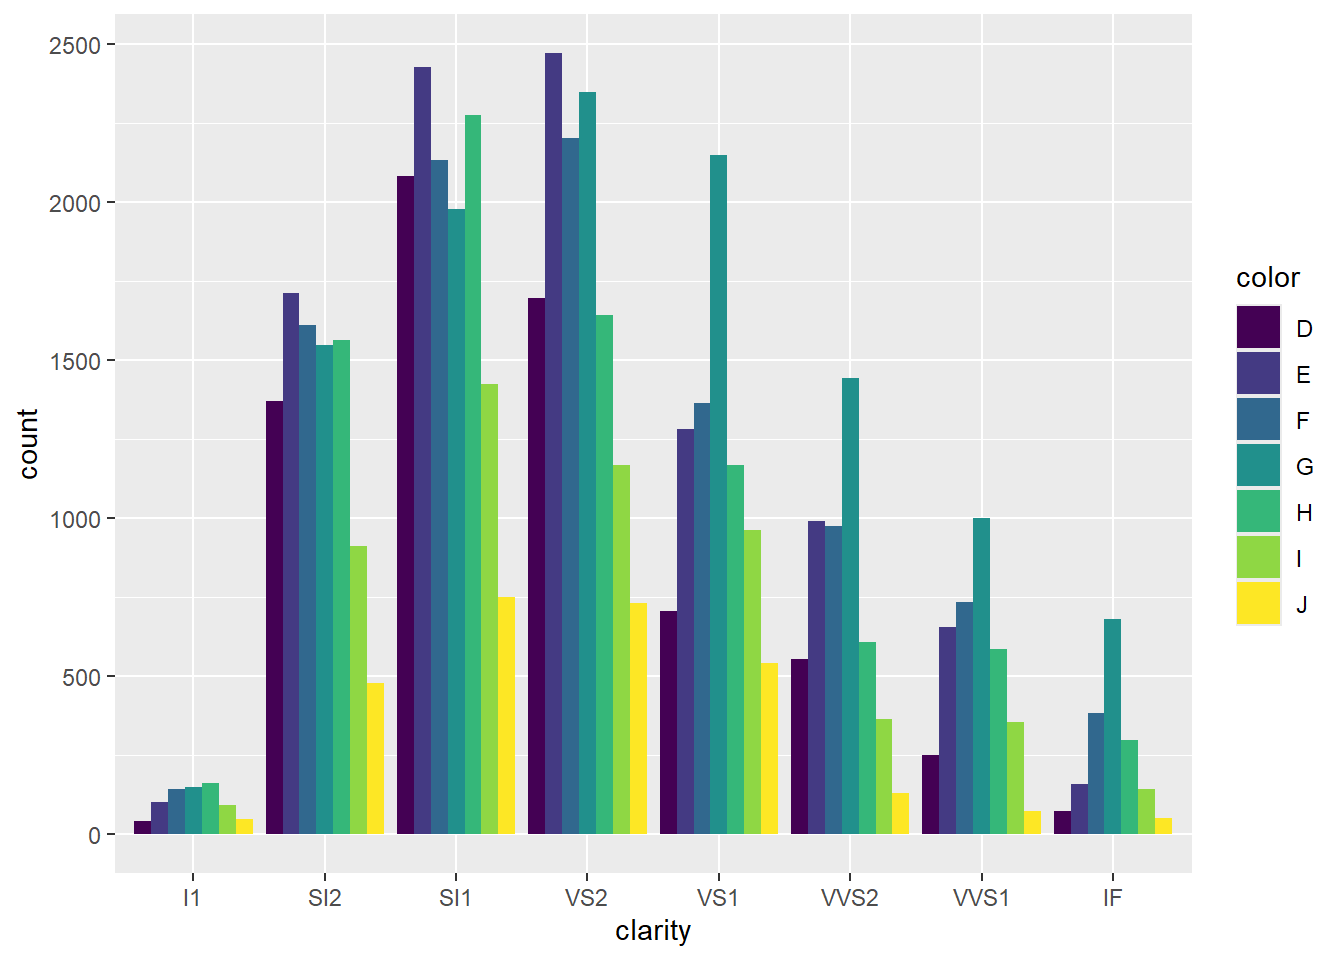
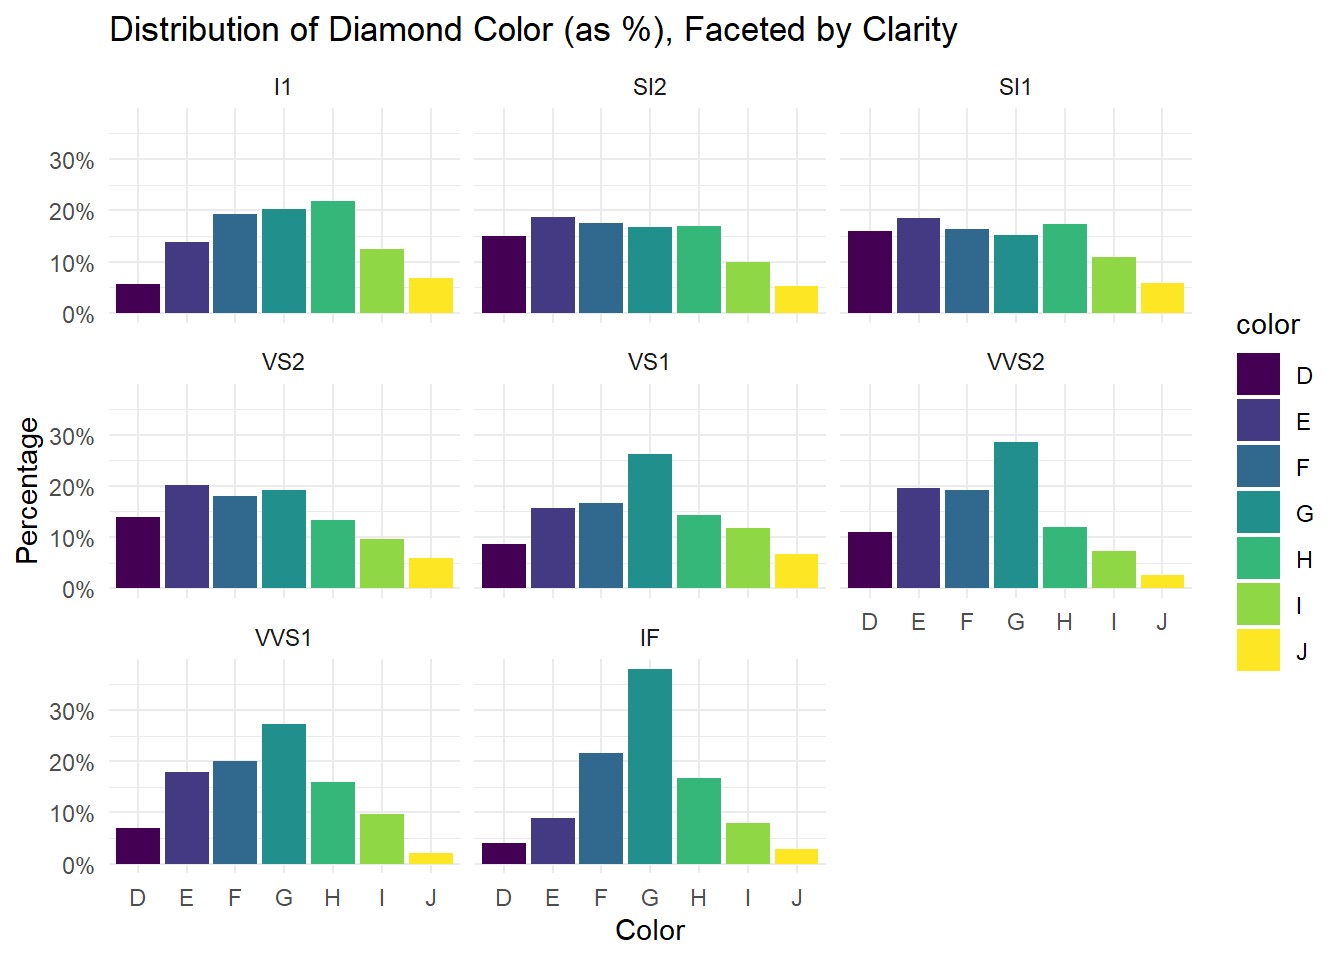
ggplot(diamonds, aes(x=color)) + geom_bar() + facet_wrap(~clarity)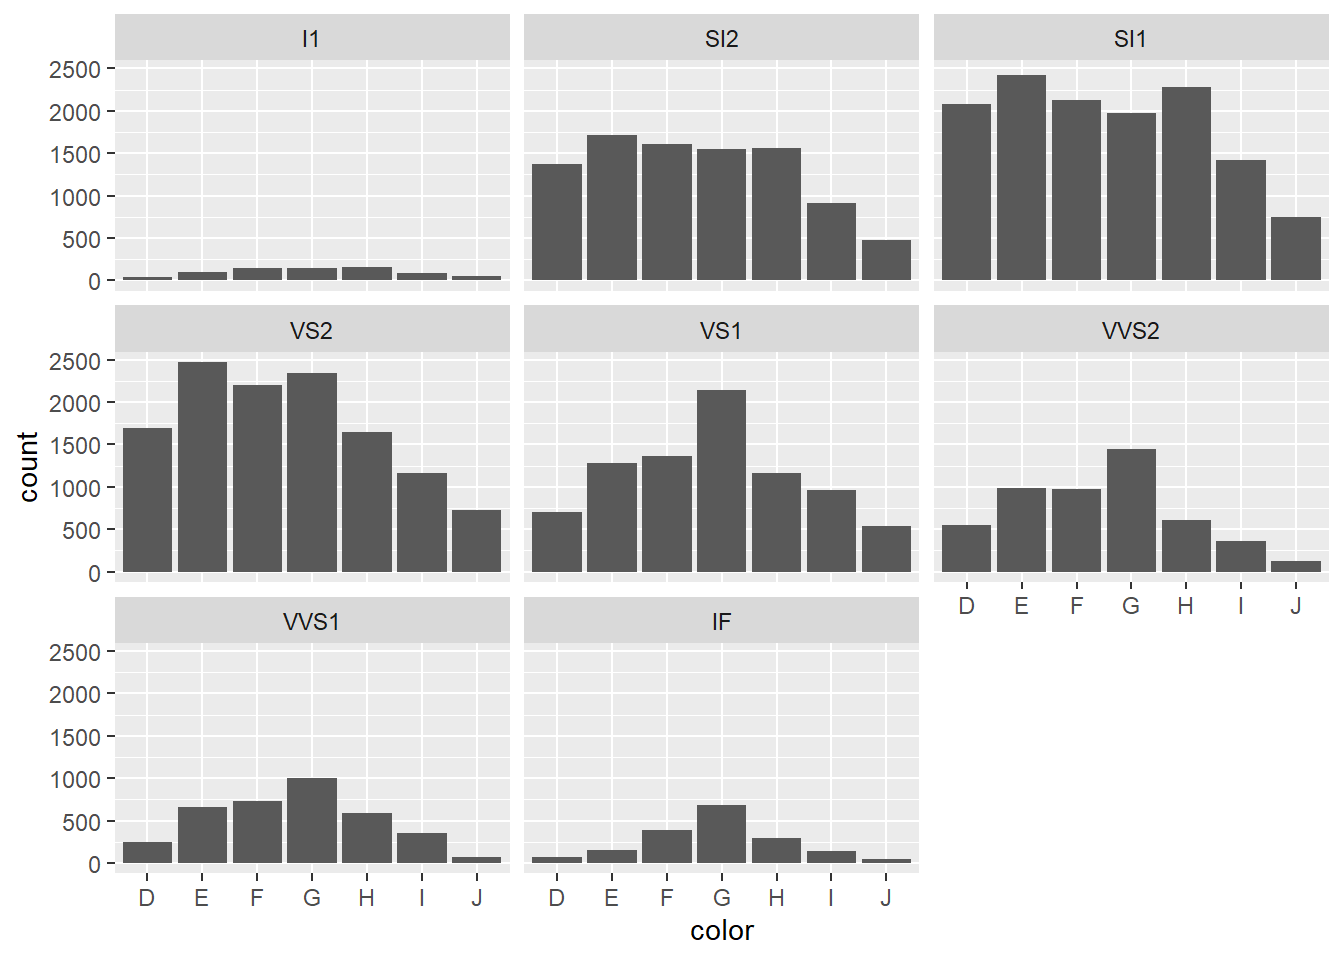
library(ggplot2)
data("diamonds")
ggplot(diamonds, aes(x=clarity, fill=color)) + geom_bar()
ggplot(diamonds, aes(x=clarity, fill=color)) + geom_bar(position = "dodge")
ggplot(diamonds, aes(x=color)) + geom_bar() + facet_wrap(~clarity)
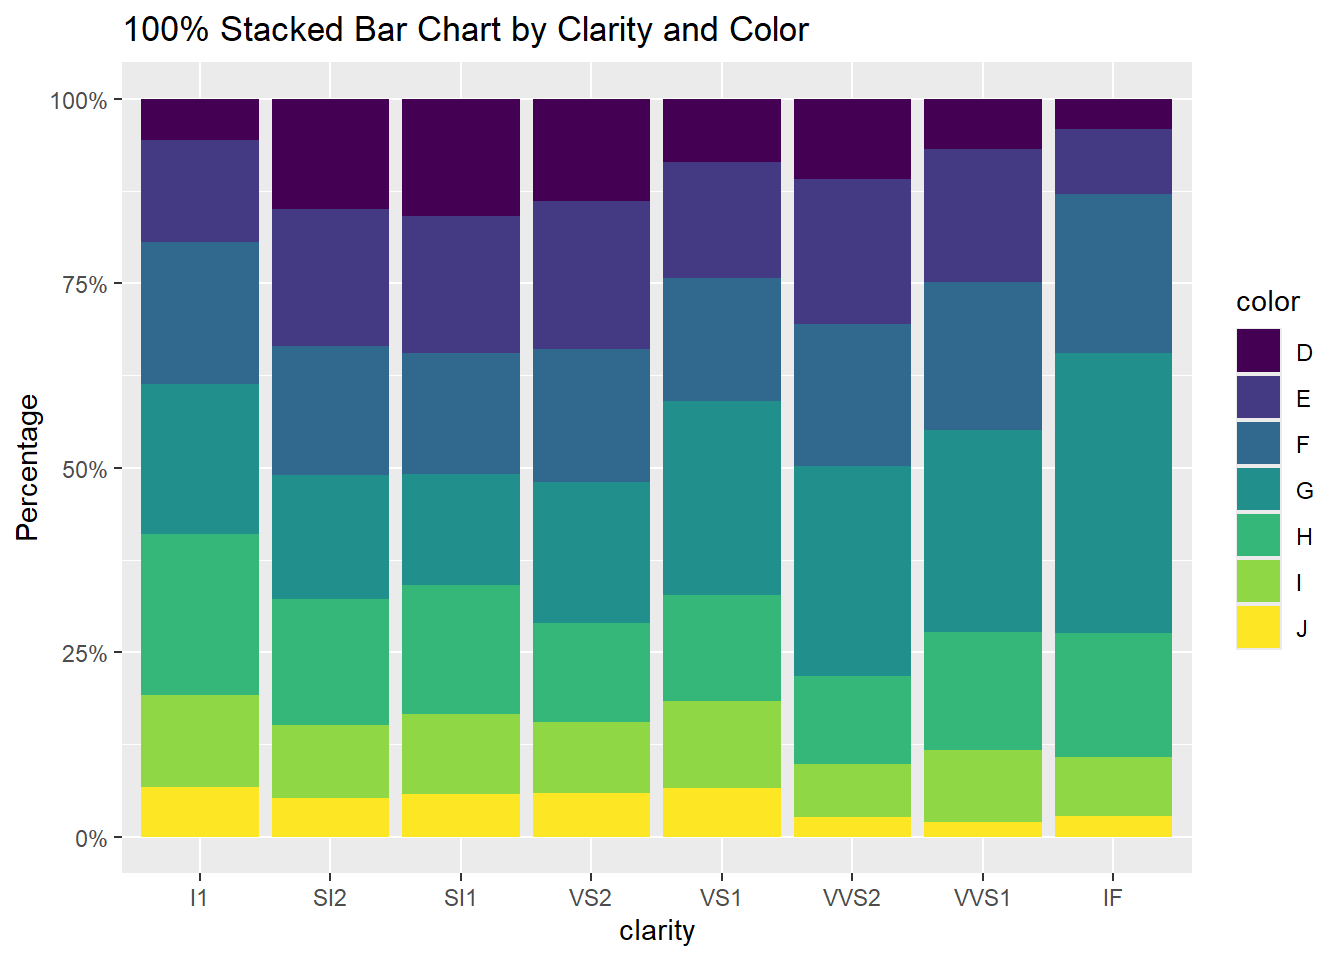
ggplot(diamonds, aes(x = clarity, fill = color)) +
  geom_bar(position = "fill") +
  scale_y_continuous(labels = scales::percent) +
  labs(y = "Percentage", title = "100% Stacked Bar Chart by Clarity and Color")