STA 1132 Descriptive Statistics
Definition of Statistics and Role of Statistics
Dr. Thiyanga S. Talagala
Department of Statistics, Faculty of Applied Sciences
University of Sri Jayewardenepura, Sri Lanka
Department of Statistics, Faculty of Applied Sciences
University of Sri Jayewardenepura, Sri Lanka
Learning Objective:
By the end of this lecture, students will be able to:
- Define statistics and explain its fundamental concepts.
- Identify the various fields and contexts where statistics is used.
- Explain the importance and significance of statistics in decision-making and problem-solving processes.
Outline
What is statistics?
Where do we use statistics?
Why do we need statistics?
Outline
What is statistics?
Where do we use statistics?
Why do we need statistics?
What is Statistics?
The science of collecting, organizing, and analyzing data, and presenting and interpreting the results derived from that data to gain insights and make informed decisions.
The science of collecting, organizing, and analyzing data, and presenting and interpreting the results derived from that data to gain insights and make informed decisions.
The science of collecting, organizing, and analyzing data, and presenting and interpreting the results derived from that data to gain insights and make informed decisions.
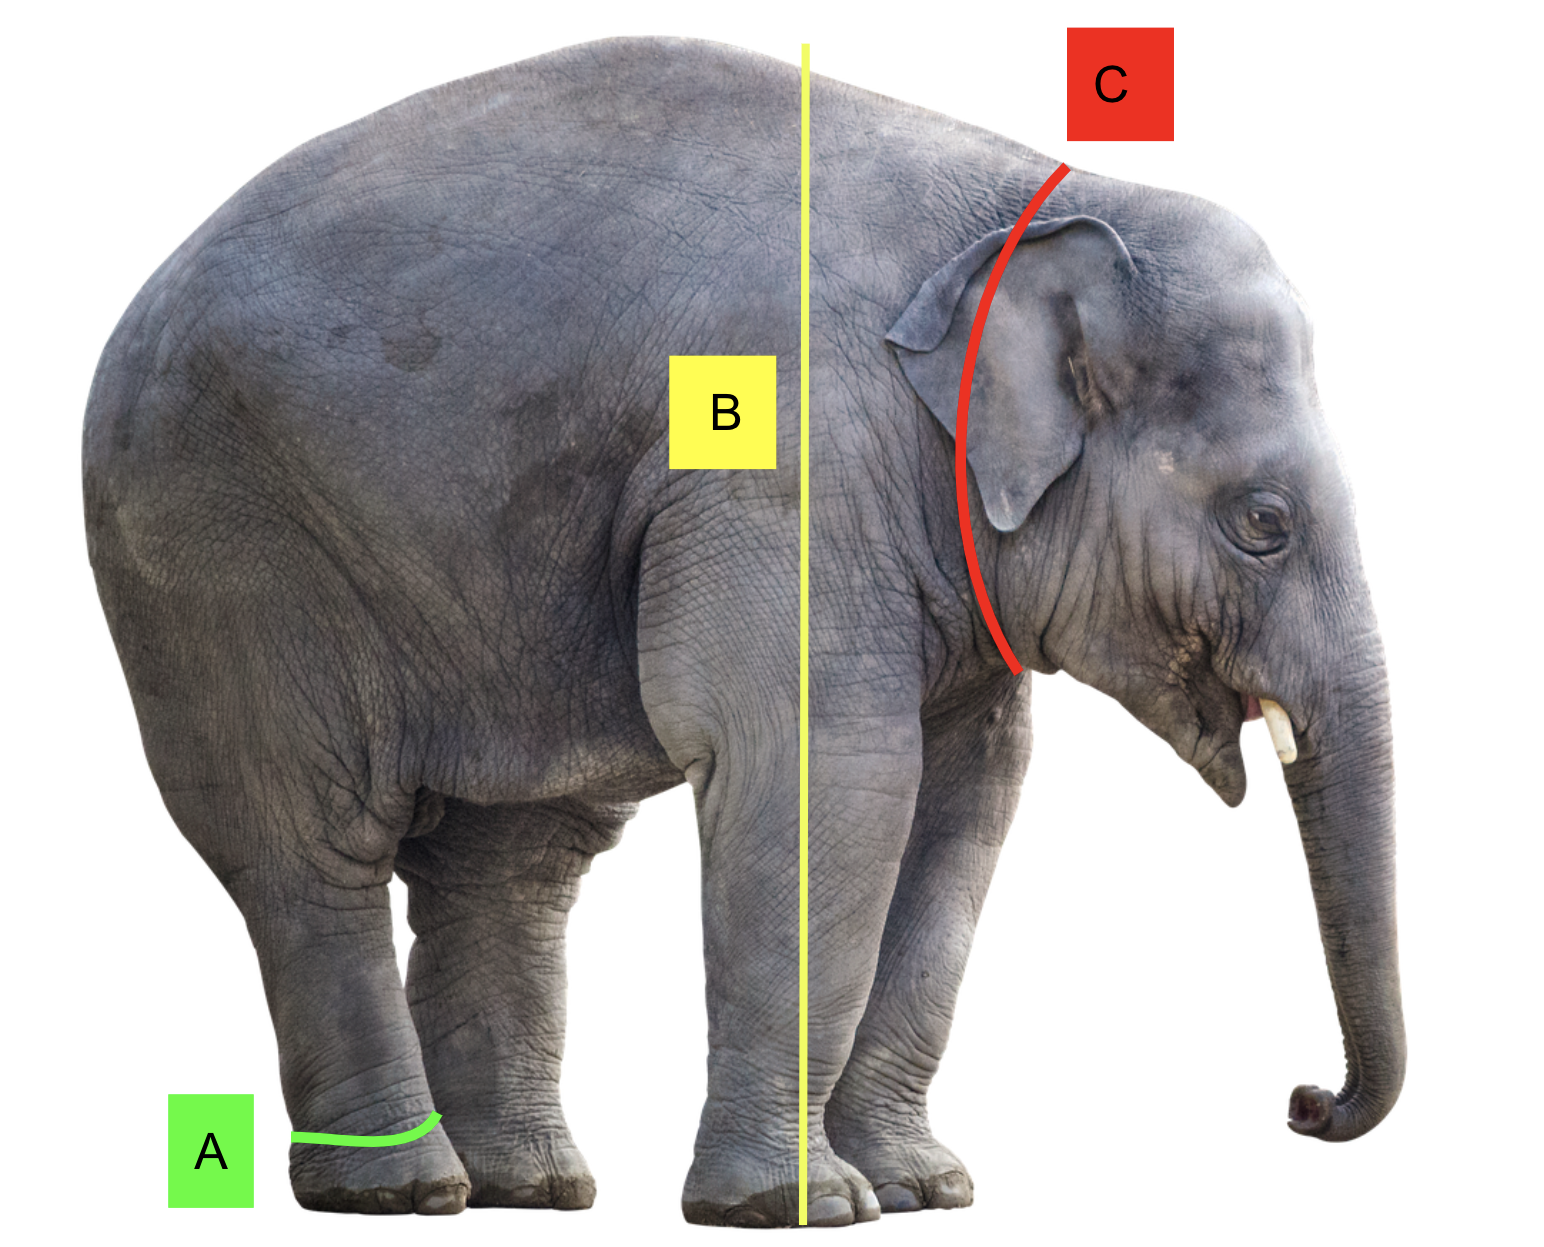
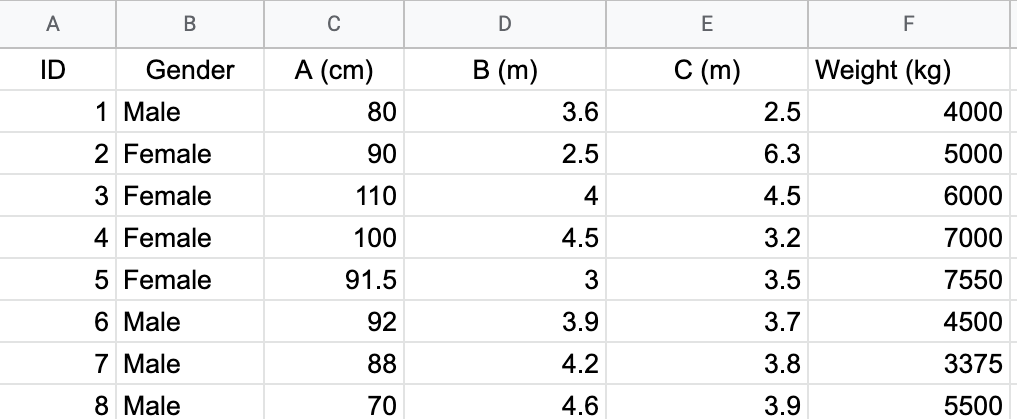
Tabular data (Structured data)
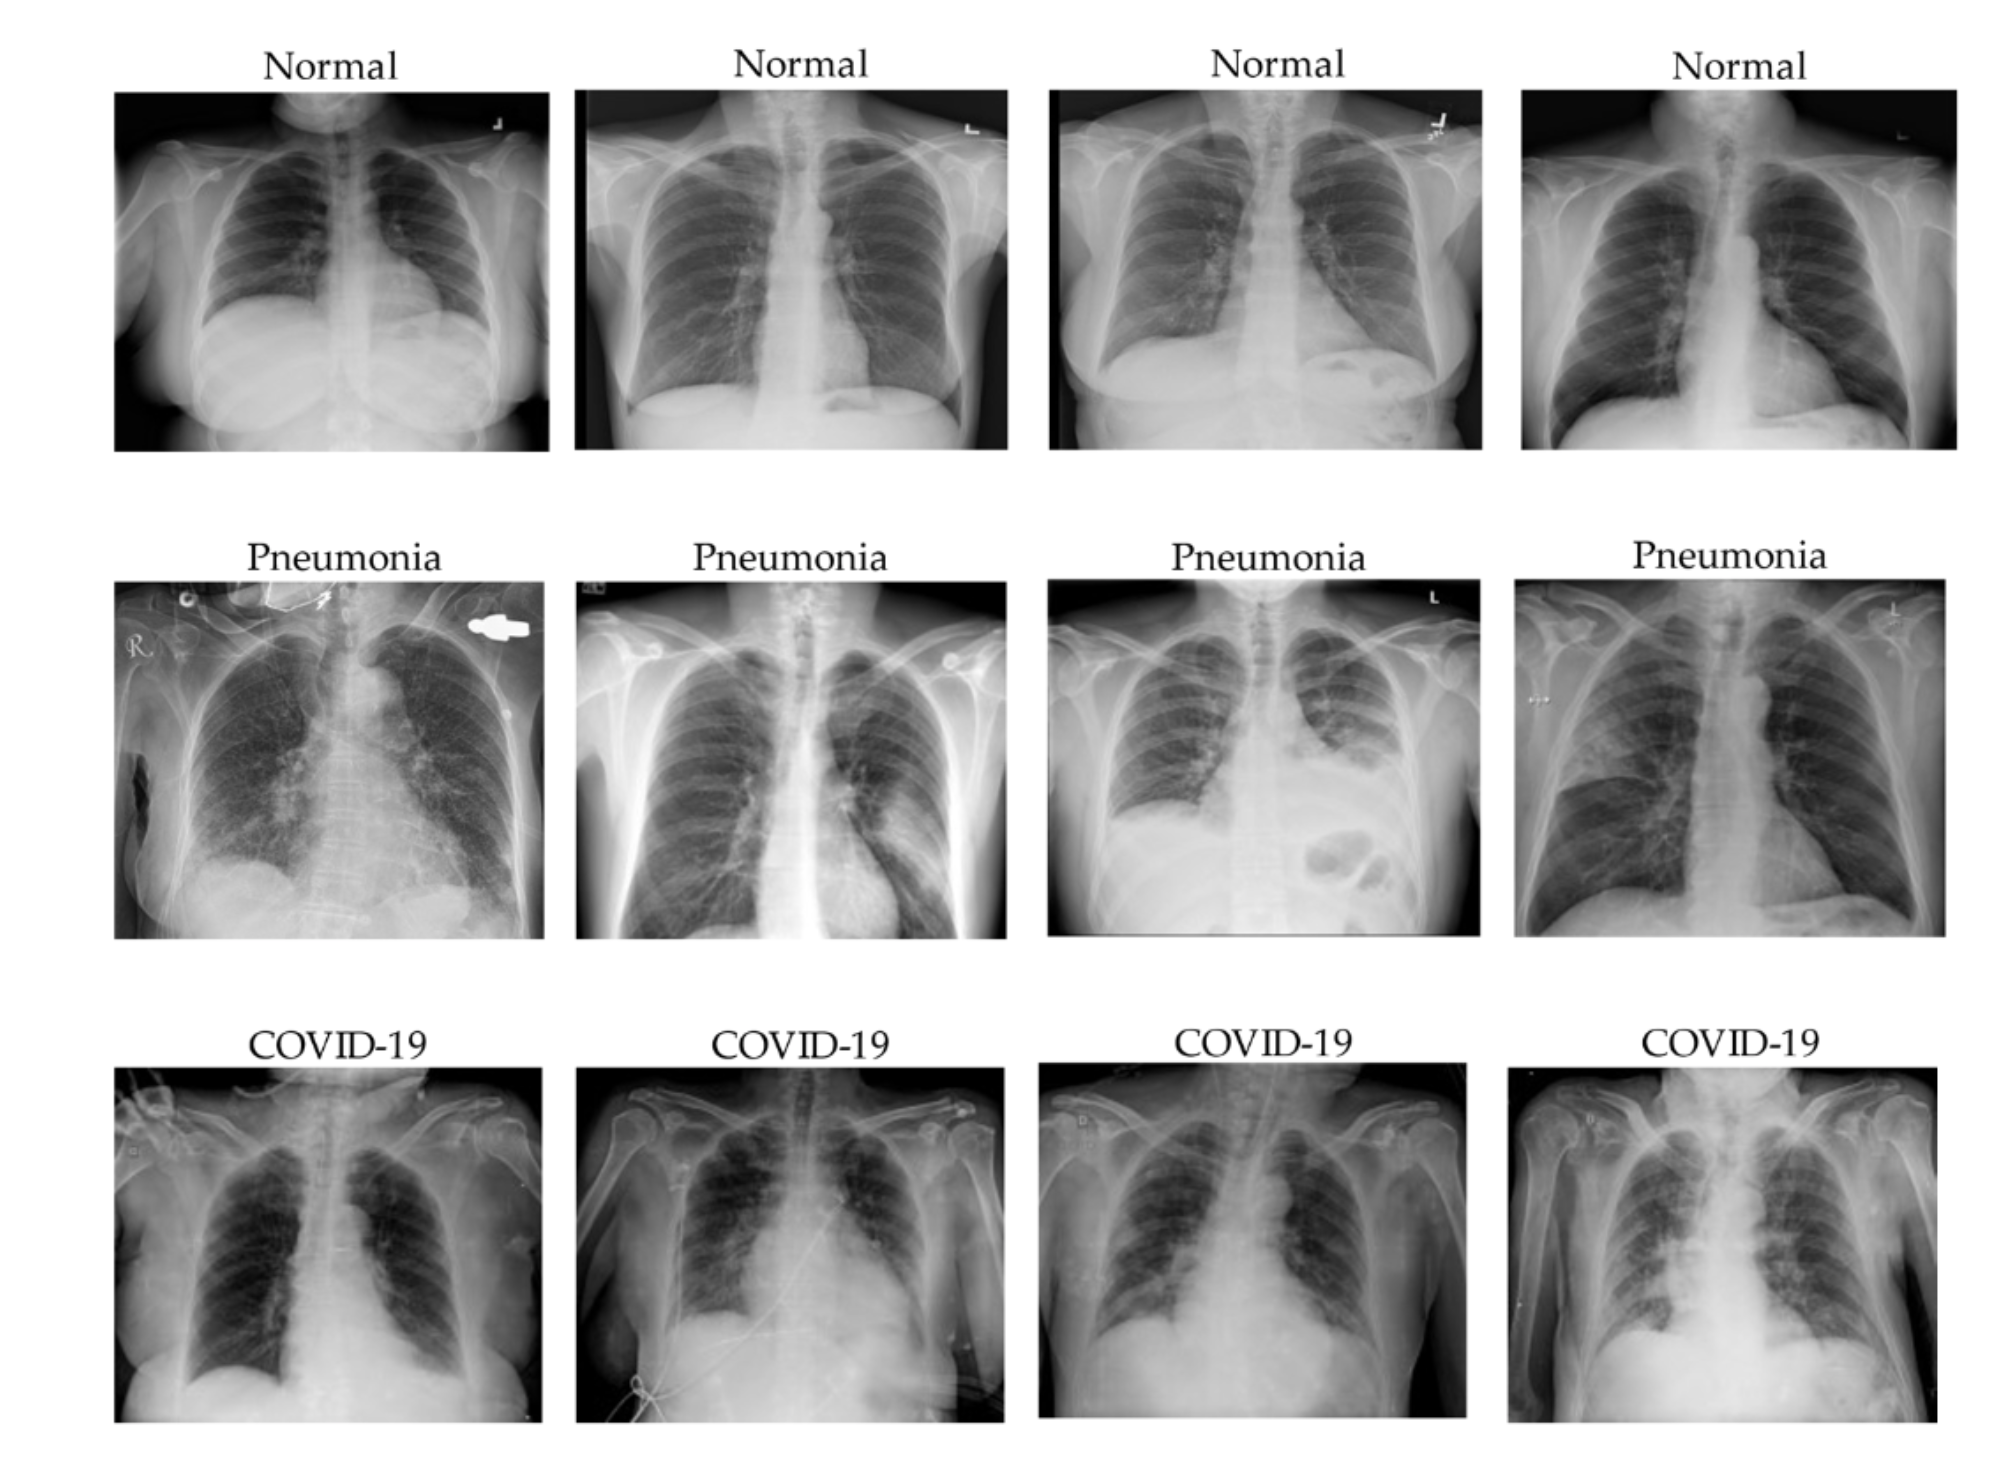
Source: Le Dinh, T., Lee, S. H., Kwon, S. G., & Kwon, K. R. (2022). COVID-19 Chest X-ray Classification and Severity Assessment Using Convolutional and Transformer Neural Networks. Applied Sciences, 12(10), 4861.
Tabular data (Structured data)
Image data
Tabular data (Structured data)
Audio data

Image data
Tabular data (Structured data)
Audio data
The science of collecting, organizing, and analyzing data, and presenting and interpreting the results derived from that data to gain insights and make informed decisions.
How to choose a representative subset of the population?
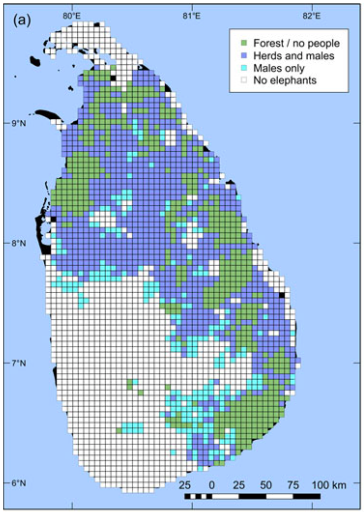
Elephant distribution map for Sri Lanka. Image courtesy of Fernando et al (2019). (accessed from https://news.mongabay.com/2019/02/sri-lanka-gets-its-first-data-based-elephant-distribution-map/)
The science of collecting, organizing, and analyzing data, and presenting and interpreting the results derived from that data to gain insights and make informed decisions.
The science of collecting, organizing, and analyzing data, and presenting and interpreting the results derived from that data to gain insights and make informed decisions.
     ID Gender     A   B   C Weight
1     1   Male  80.0 3.6 2.5   4000
2     2 Female  90.0 2.5 6.3   5000
3     3 Female 110.0 4.0 4.5   6000
4     4 Female 100.0 4.5 3.2   7000
5     5 Female  91.5 3.0 3.5   7550
6     6   Male  92.0 3.9 3.7   4500
7     7   Male  88.0 4.2 3.8   3375
8     8   Male  70.0 4.6 3.9   5500
9     9 Female  99.6 4.9 3.4   4988
10   10 Female 100.2 5.5 2.8   5594
11   11 Female  98.9 3.4 4.9   3530
12   12 Female 101.8 2.9 3.3   3007
13   13 Female 100.0 4.2 4.2   4259
14   14 Female 100.3 3.5 2.6   3595
15   15 Female  98.7 4.4 3.0   4516
16   16 Female  98.4 2.2 3.6   2307
17   17 Female 100.5 2.7 3.8   2847
18   18 Female 100.1 2.9 4.5   2991
19   19 Female 100.2 2.8 2.6   2906
20   20 Female  99.9 4.6 3.0   4694
21   21 Female  99.6 4.8 2.5   4905
22   22 Female 101.0 3.6 0.7   3694
23   23 Female 100.3 3.1 3.6   3242
24   24 Female  98.6 4.2 3.6   4281
25   25 Female  99.5 3.4 5.0   3534
26   26 Female 100.6 2.9 4.6   3044
27   27 Female  99.5 3.4 4.7   3455
28   28 Female 100.9 3.2 3.6   3324
29   29 Female  98.1 2.7 3.3   2793
30   30 Female  98.5 2.9 5.3   3050
31   31 Female  99.3 3.5 3.1   3622
32   32 Female 101.5 3.8 2.7   3870
33   33 Female 100.8 3.5 3.7   3611
34   34 Female 100.0 4.4 5.1   4482
35   35 Female  98.5 2.5 3.9   2563
36   36 Female  99.9 4.1 3.9   4155
37   37 Female  99.8 4.0 3.3   4117
38   38 Female  99.2 3.9 1.7   4023
39   39 Female 100.2 5.4 4.4   5535
40   40 Female 101.2 3.7 3.5   3778
41   41 Female 100.4 4.1 2.4   4151
42   42 Female  99.8 3.6 4.2   3677
43   43 Female 100.9 3.4 3.4   3504
44   44 Female 100.5 2.4 3.5   2494
45   45 Female  98.6 4.5 3.6   4631
46   46 Female  99.2 3.0 2.6   3098
47   47 Female  99.7 4.3 3.0   4351
48   48 Female 100.5 3.2 3.9   3274
49   49 Female  99.8 3.5 3.4   3575
50   50 Female  99.9 1.7 3.5   1796
51   51 Female  99.9 2.0 4.4   2075
52   52 Female 100.6 3.2 3.6   3273
53   53 Female 100.4 2.7 3.0   2837
54   54 Female 101.2 3.0 4.1   3140
55   55   Male  98.4 2.3 4.9   3561
56   56   Male 102.1 3.9 3.3   5965
57   57   Male  99.7 3.5 1.9   5405
58   58   Male  98.4 1.4 4.7   2176
59   59   Male  98.7 2.5 3.8   3789
60   60   Male  98.0 1.9 3.2   2887
61   61   Male  99.5 2.3 3.0   3537
62   62   Male  99.0 2.7 1.8   4172
63   63   Male 101.0 3.3 2.8   4993
64   64   Male 100.0 3.2 4.1   4903
65   65   Male 100.1 2.1 3.5   3319
66   66   Male 100.7 1.2 3.5   1962
67   67   Male 100.2 3.4 3.5   5268
68   68   Male  99.5 3.1 4.6   4685
69   69   Male  98.9 2.6 3.9   4047
70   70   Male 101.1 6.0 3.9   9121
71   71   Male  99.3 2.6 3.3   3961
72   72   Male  99.2 4.3 3.2   6567
73   73   Male  99.4 1.9 2.8   2891
74   74   Male  99.8 1.7 3.4   2680
75   75   Male 100.1 4.9 3.3   7506
76   76   Male 100.3 3.7 2.6   5675
77   77   Male  99.7 2.4 4.2   3736
78   78   Male 100.8 4.0 4.5   6160
79   79   Male 100.8 3.3 3.6   5072
80   80   Male 102.4 3.3 2.1   4994
81   81   Male 100.8 3.3 3.3   5055
82   82   Male  98.9 3.8 4.3   5798
83   83   Male 100.2 0.7 3.1   1184
84   84   Male 100.2 4.2 4.8   6432
85   85   Male 100.0 2.3 2.6   3592
86   86   Male 100.0 2.4 4.6   3654
87   87   Male 100.7 2.0 3.0   3086
88   88   Male 100.0 2.0 2.7   3128
89   89   Male  99.0 3.8 3.5   5787
90   90   Male 100.3 1.8 3.3   2775
91   91   Male 100.4 5.1 3.9   7735
92   92   Male 101.0 4.2 4.1   6371
93   93   Male  99.1 3.7 5.4   5721
94   94   Male  98.8 3.9 4.6   5935
95   95   Male 100.3 4.2 5.1   6358
96   96   Male 100.3 3.7 2.8   5654
97   97   Male 100.0 3.1 2.1   4704
98   98   Male 100.7 2.4 3.3   3627
99   99   Male 100.4 3.8 3.3   5800
100 100 Male 99.6 1.3 3.1 2005| ID | Gender | A | B | C | Weight |
|---|---|---|---|---|---|
| 1 | Male | 80.0 | 3.6 | 2.5 | 4000 |
| 2 | Female | 90.0 | 2.5 | 6.3 | 5000 |
| 3 | Female | 110.0 | 4.0 | 4.5 | 6000 |
| 4 | Female | 100.0 | 4.5 | 3.2 | 7000 |
| 5 | Female | 91.5 | 3.0 | 3.5 | 7550 |
| 6 | Male | 92.0 | 3.9 | 3.7 | 4500 |
| 7 | Male | 88.0 | 4.2 | 3.8 | 3375 |
| 8 | Male | 70.0 | 4.6 | 3.9 | 5500 |
| 9 | Female | 99.6 | 4.9 | 3.4 | 4988 |
| 10 | Female | 100.2 | 5.5 | 2.8 | 5594 |
| 11 | Female | 98.9 | 3.4 | 4.9 | 3530 |
| 12 | Female | 101.8 | 2.9 | 3.3 | 3007 |
| 13 | Female | 100.0 | 4.2 | 4.2 | 4259 |
| 14 | Female | 100.3 | 3.5 | 2.6 | 3595 |
| 15 | Female | 98.7 | 4.4 | 3.0 | 4516 |
| 16 | Female | 98.4 | 2.2 | 3.6 | 2307 |
| 17 | Female | 100.5 | 2.7 | 3.8 | 2847 |
| 18 | Female | 100.1 | 2.9 | 4.5 | 2991 |
| 19 | Female | 100.2 | 2.8 | 2.6 | 2906 |
| 20 | Female | 99.9 | 4.6 | 3.0 | 4694 |
| 21 | Female | 99.6 | 4.8 | 2.5 | 4905 |
| 22 | Female | 101.0 | 3.6 | 0.7 | 3694 |
| 23 | Female | 100.3 | 3.1 | 3.6 | 3242 |
| 24 | Female | 98.6 | 4.2 | 3.6 | 4281 |
| 25 | Female | 99.5 | 3.4 | 5.0 | 3534 |
| 26 | Female | 100.6 | 2.9 | 4.6 | 3044 |
| 27 | Female | 99.5 | 3.4 | 4.7 | 3455 |
| 28 | Female | 100.9 | 3.2 | 3.6 | 3324 |
| ID | Gender | A | B | C | Weight | |
|---|---|---|---|---|---|---|
| 29 | 29 | Female | 98.1 | 2.7 | 3.3 | 2793 |
| 30 | 30 | Female | 98.5 | 2.9 | 5.3 | 3050 |
| 31 | 31 | Female | 99.3 | 3.5 | 3.1 | 3622 |
| 32 | 32 | Female | 101.5 | 3.8 | 2.7 | 3870 |
| 33 | 33 | Female | 100.8 | 3.5 | 3.7 | 3611 |
| 34 | 34 | Female | 100.0 | 4.4 | 5.1 | 4482 |
| 35 | 35 | Female | 98.5 | 2.5 | 3.9 | 2563 |
| 36 | 36 | Female | 99.9 | 4.1 | 3.9 | 4155 |
| 37 | 37 | Female | 99.8 | 4.0 | 3.3 | 4117 |
| 38 | 38 | Female | 99.2 | 3.9 | 1.7 | 4023 |
| 39 | 39 | Female | 100.2 | 5.4 | 4.4 | 5535 |
| 40 | 40 | Female | 101.2 | 3.7 | 3.5 | 3778 |
| 41 | 41 | Female | 100.4 | 4.1 | 2.4 | 4151 |
| 42 | 42 | Female | 99.8 | 3.6 | 4.2 | 3677 |
| 43 | 43 | Female | 100.9 | 3.4 | 3.4 | 3504 |
| 44 | 44 | Female | 100.5 | 2.4 | 3.5 | 2494 |
| 45 | 45 | Female | 98.6 | 4.5 | 3.6 | 4631 |
| 46 | 46 | Female | 99.2 | 3.0 | 2.6 | 3098 |
| 47 | 47 | Female | 99.7 | 4.3 | 3.0 | 4351 |
| 48 | 48 | Female | 100.5 | 3.2 | 3.9 | 3274 |
| 49 | 49 | Female | 99.8 | 3.5 | 3.4 | 3575 |
| 50 | 50 | Female | 99.9 | 1.7 | 3.5 | 1796 |
| 51 | 51 | Female | 99.9 | 2.0 | 4.4 | 2075 |
| 52 | 52 | Female | 100.6 | 3.2 | 3.6 | 3273 |
| 53 | 53 | Female | 100.4 | 2.7 | 3.0 | 2837 |
| 54 | 54 | Female | 101.2 | 3.0 | 4.1 | 3140 |
| 55 | 55 | Male | 98.4 | 2.3 | 4.9 | 3561 |
| 56 | 56 | Male | 102.1 | 3.9 | 3.3 | 5965 |
| ID | Gender | A | B | C | Weight | |
|---|---|---|---|---|---|---|
| 57 | 57 | Male | 99.7 | 3.5 | 1.9 | 5405 |
| 58 | 58 | Male | 98.4 | 1.4 | 4.7 | 2176 |
| 59 | 59 | Male | 98.7 | 2.5 | 3.8 | 3789 |
| 60 | 60 | Male | 98.0 | 1.9 | 3.2 | 2887 |
| 61 | 61 | Male | 99.5 | 2.3 | 3.0 | 3537 |
| 62 | 62 | Male | 99.0 | 2.7 | 1.8 | 4172 |
| 63 | 63 | Male | 101.0 | 3.3 | 2.8 | 4993 |
| 64 | 64 | Male | 100.0 | 3.2 | 4.1 | 4903 |
| 65 | 65 | Male | 100.1 | 2.1 | 3.5 | 3319 |
| 66 | 66 | Male | 100.7 | 1.2 | 3.5 | 1962 |
| 67 | 67 | Male | 100.2 | 3.4 | 3.5 | 5268 |
| 68 | 68 | Male | 99.5 | 3.1 | 4.6 | 4685 |
| 69 | 69 | Male | 98.9 | 2.6 | 3.9 | 4047 |
| 70 | 70 | Male | 101.1 | 6.0 | 3.9 | 9121 |
| 71 | 71 | Male | 99.3 | 2.6 | 3.3 | 3961 |
| 72 | 72 | Male | 99.2 | 4.3 | 3.2 | 6567 |
| 73 | 73 | Male | 99.4 | 1.9 | 2.8 | 2891 |
| 74 | 74 | Male | 99.8 | 1.7 | 3.4 | 2680 |
| 75 | 75 | Male | 100.1 | 4.9 | 3.3 | 7506 |
| 76 | 76 | Male | 100.3 | 3.7 | 2.6 | 5675 |
| 77 | 77 | Male | 99.7 | 2.4 | 4.2 | 3736 |
| 78 | 78 | Male | 100.8 | 4.0 | 4.5 | 6160 |
| 79 | 79 | Male | 100.8 | 3.3 | 3.6 | 5072 |
| 80 | 80 | Male | 102.4 | 3.3 | 2.1 | 4994 |
| 81 | 81 | Male | 100.8 | 3.3 | 3.3 | 5055 |
| 82 | 82 | Male | 98.9 | 3.8 | 4.3 | 5798 |
| 83 | 83 | Male | 100.2 | 0.7 | 3.1 | 1184 |
| ID | Gender | A | B | C | Weight | |
|---|---|---|---|---|---|---|
| 84 | 84 | Male | 100.2 | 4.2 | 4.8 | 6432 |
| 85 | 85 | Male | 100.0 | 2.3 | 2.6 | 3592 |
| 86 | 86 | Male | 100.0 | 2.4 | 4.6 | 3654 |
| 87 | 87 | Male | 100.7 | 2.0 | 3.0 | 3086 |
| 88 | 88 | Male | 100.0 | 2.0 | 2.7 | 3128 |
| 89 | 89 | Male | 99.0 | 3.8 | 3.5 | 5787 |
| 90 | 90 | Male | 100.3 | 1.8 | 3.3 | 2775 |
| 91 | 91 | Male | 100.4 | 5.1 | 3.9 | 7735 |
| 92 | 92 | Male | 101.0 | 4.2 | 4.1 | 6371 |
| 93 | 93 | Male | 99.1 | 3.7 | 5.4 | 5721 |
| 94 | 94 | Male | 98.8 | 3.9 | 4.6 | 5935 |
| 95 | 95 | Male | 100.3 | 4.2 | 5.1 | 6358 |
| 96 | 96 | Male | 100.3 | 3.7 | 2.8 | 5654 |
| 97 | 97 | Male | 100.0 | 3.1 | 2.1 | 4704 |
| 98 | 98 | Male | 100.7 | 2.4 | 3.3 | 3627 |
| 99 | 99 | Male | 100.4 | 3.8 | 3.3 | 5800 |
| 100 | 100 | Male | 99.6 | 1.3 | 3.1 | 2005 |
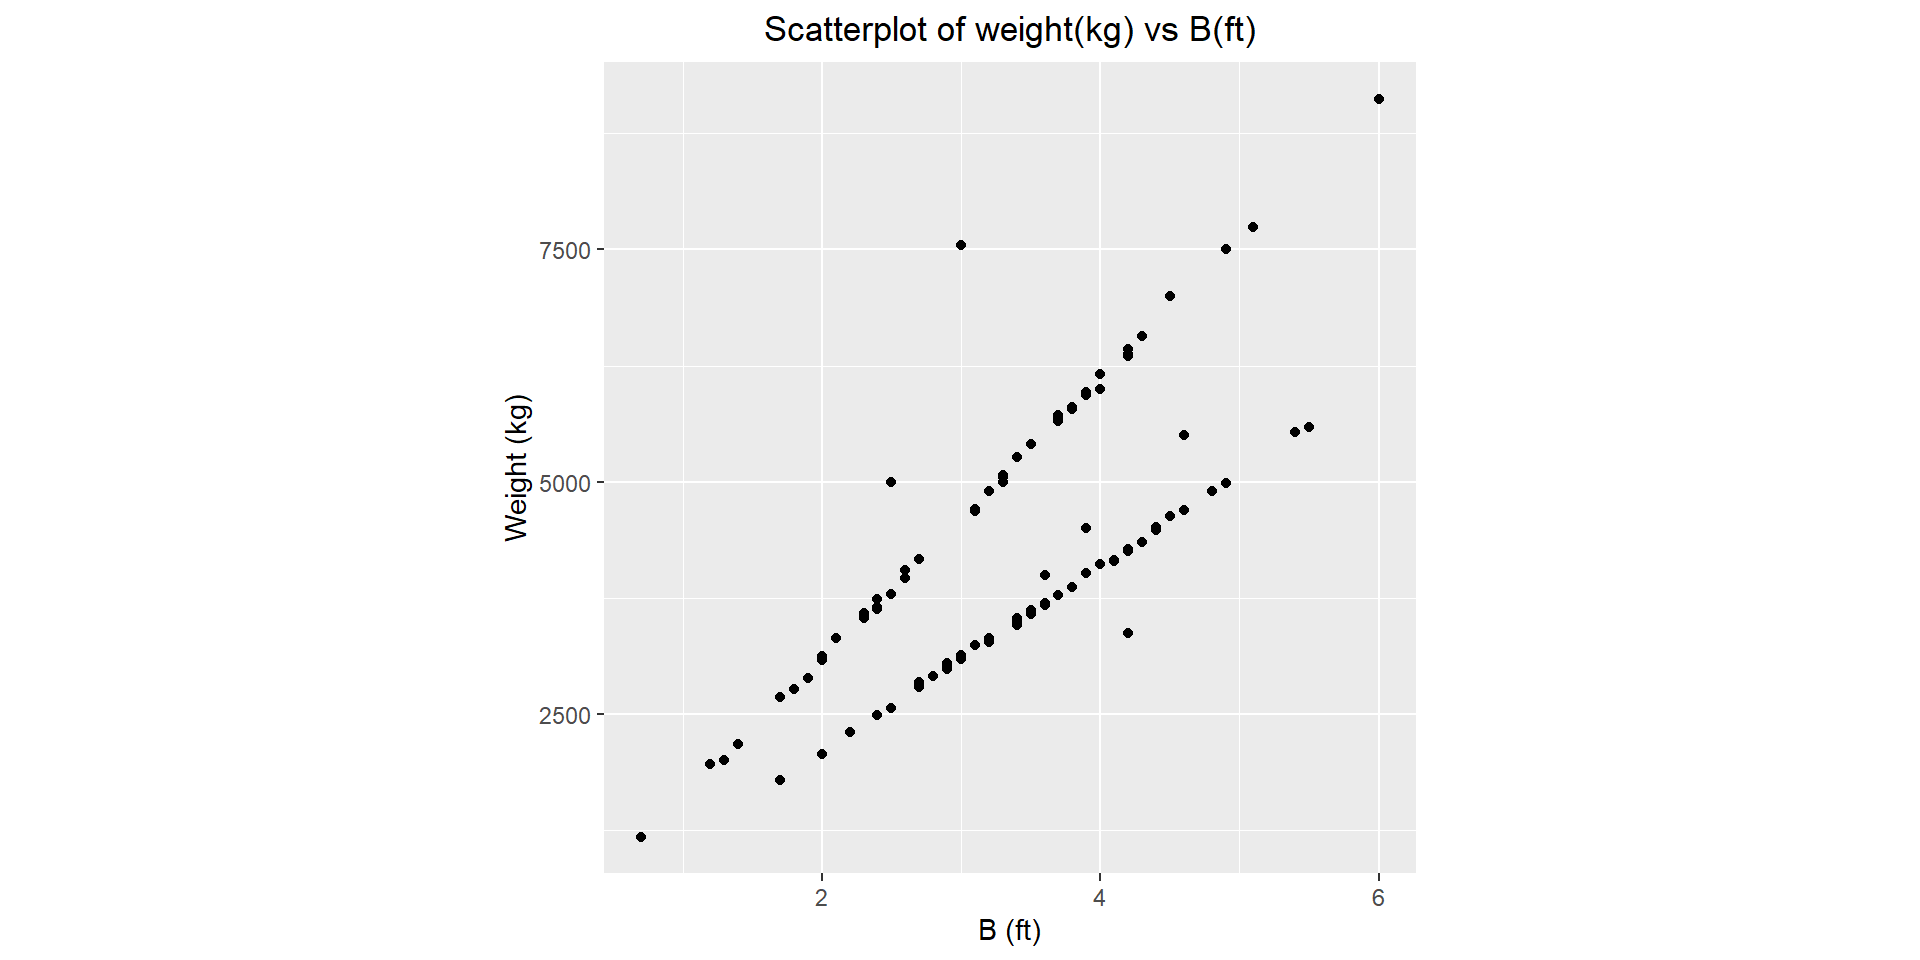
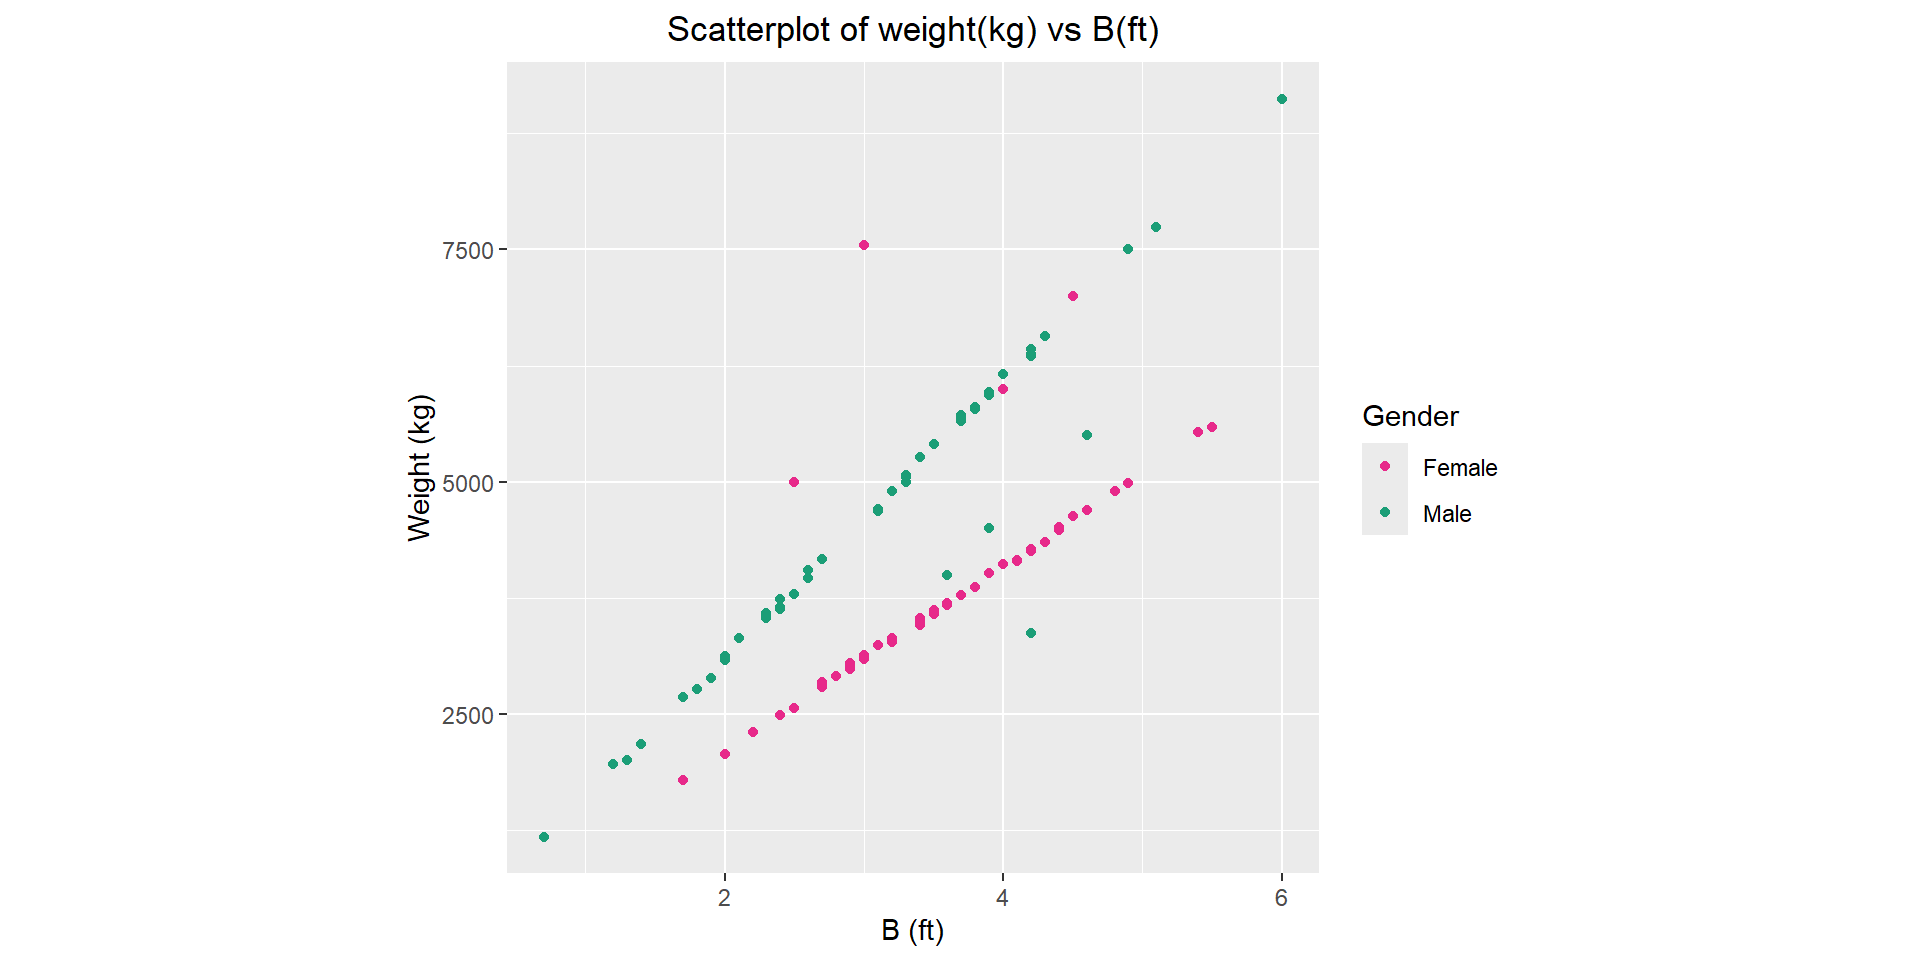
| ID | Gender | B | Weight |
|---|---|---|---|
| 1 | Male | 3.6 | 4000 |
| 2 | Female | 2.5 | 5000 |
| 3 | Female | 4.0 | 6000 |
| 4 | Female | 4.5 | 7000 |
| 5 | Female | 3.0 | 7550 |
| 6 | Male | 3.9 | 4500 |
| 7 | Male | 4.2 | 3375 |
| 8 | Male | 4.6 | 5500 |
| 9 | Female | 4.9 | 4988 |
| 10 | Female | 5.5 | 5594 |
| 11 | Female | 3.4 | 3530 |
| 12 | Female | 2.9 | 3007 |
| 13 | Female | 4.2 | 4259 |
| 14 | Female | 3.5 | 3595 |
| 15 | Female | 4.4 | 4516 |
| 16 | Female | 2.2 | 2307 |
| 17 | Female | 2.7 | 2847 |
| 18 | Female | 2.9 | 2991 |
| 19 | Female | 2.8 | 2906 |
| 20 | Female | 4.6 | 4694 |
| 21 | Female | 4.8 | 4905 |
| 22 | Female | 3.6 | 3694 |
| 23 | Female | 3.1 | 3242 |
| 24 | Female | 4.2 | 4281 |
| 25 | Female | 3.4 | 3534 |
| 26 | Female | 2.9 | 3044 |
| 27 | Female | 3.4 | 3455 |
| 28 | Female | 3.2 | 3324 |
| ID | Gender | B | Weight | |
|---|---|---|---|---|
| 29 | 29 | Female | 2.7 | 2793 |
| 30 | 30 | Female | 2.9 | 3050 |
| 31 | 31 | Female | 3.5 | 3622 |
| 32 | 32 | Female | 3.8 | 3870 |
| 33 | 33 | Female | 3.5 | 3611 |
| 34 | 34 | Female | 4.4 | 4482 |
| 35 | 35 | Female | 2.5 | 2563 |
| 36 | 36 | Female | 4.1 | 4155 |
| 37 | 37 | Female | 4.0 | 4117 |
| 38 | 38 | Female | 3.9 | 4023 |
| 39 | 39 | Female | 5.4 | 5535 |
| 40 | 40 | Female | 3.7 | 3778 |
| 41 | 41 | Female | 4.1 | 4151 |
| 42 | 42 | Female | 3.6 | 3677 |
| 43 | 43 | Female | 3.4 | 3504 |
| 44 | 44 | Female | 2.4 | 2494 |
| 45 | 45 | Female | 4.5 | 4631 |
| 46 | 46 | Female | 3.0 | 3098 |
| 47 | 47 | Female | 4.3 | 4351 |
| 48 | 48 | Female | 3.2 | 3274 |
| 49 | 49 | Female | 3.5 | 3575 |
| 50 | 50 | Female | 1.7 | 1796 |
| 51 | 51 | Female | 2.0 | 2075 |
| 52 | 52 | Female | 3.2 | 3273 |
| 53 | 53 | Female | 2.7 | 2837 |
| 54 | 54 | Female | 3.0 | 3140 |
| 55 | 55 | Male | 2.3 | 3561 |
| 56 | 56 | Male | 3.9 | 5965 |
| ID | Gender | B | Weight | |
|---|---|---|---|---|
| 57 | 57 | Male | 3.5 | 5405 |
| 58 | 58 | Male | 1.4 | 2176 |
| 59 | 59 | Male | 2.5 | 3789 |
| 60 | 60 | Male | 1.9 | 2887 |
| 61 | 61 | Male | 2.3 | 3537 |
| 62 | 62 | Male | 2.7 | 4172 |
| 63 | 63 | Male | 3.3 | 4993 |
| 64 | 64 | Male | 3.2 | 4903 |
| 65 | 65 | Male | 2.1 | 3319 |
| 66 | 66 | Male | 1.2 | 1962 |
| 67 | 67 | Male | 3.4 | 5268 |
| 68 | 68 | Male | 3.1 | 4685 |
| 69 | 69 | Male | 2.6 | 4047 |
| 70 | 70 | Male | 6.0 | 9121 |
| 71 | 71 | Male | 2.6 | 3961 |
| 72 | 72 | Male | 4.3 | 6567 |
| 73 | 73 | Male | 1.9 | 2891 |
| 74 | 74 | Male | 1.7 | 2680 |
| 75 | 75 | Male | 4.9 | 7506 |
| 76 | 76 | Male | 3.7 | 5675 |
| 77 | 77 | Male | 2.4 | 3736 |
| 78 | 78 | Male | 4.0 | 6160 |
| 79 | 79 | Male | 3.3 | 5072 |
| 80 | 80 | Male | 3.3 | 4994 |
| 81 | 81 | Male | 3.3 | 5055 |
| 82 | 82 | Male | 3.8 | 5798 |
| 83 | 83 | Male | 0.7 | 1184 |
| ID | Gender | B | Weight | |
|---|---|---|---|---|
| 84 | 84 | Male | 4.2 | 6432 |
| 85 | 85 | Male | 2.3 | 3592 |
| 86 | 86 | Male | 2.4 | 3654 |
| 87 | 87 | Male | 2.0 | 3086 |
| 88 | 88 | Male | 2.0 | 3128 |
| 89 | 89 | Male | 3.8 | 5787 |
| 90 | 90 | Male | 1.8 | 2775 |
| 91 | 91 | Male | 5.1 | 7735 |
| 92 | 92 | Male | 4.2 | 6371 |
| 93 | 93 | Male | 3.7 | 5721 |
| 94 | 94 | Male | 3.9 | 5935 |
| 95 | 95 | Male | 4.2 | 6358 |
| 96 | 96 | Male | 3.7 | 5654 |
| 97 | 97 | Male | 3.1 | 4704 |
| 98 | 98 | Male | 2.4 | 3627 |
| 99 | 99 | Male | 3.8 | 5800 |
| 100 | 100 | Male | 1.3 | 2005 |
Summary measures
| Gender | A | B | C | Weight | |
|---|---|---|---|---|---|
| Female:50 | Min. : 70.00 | Min. :0.700 | Min. :0.700 | Min. :1184 | |
| Male :50 | 1st Qu.: 99.20 | 1st Qu.:2.600 | 1st Qu.:3.000 | 1st Qu.:3216 | |
| NA | Median :100.00 | Median :3.400 | Median :3.500 | Median :3916 | |
| NA | Mean : 99.16 | Mean :3.311 | Mean :3.562 | Mean :4225 | |
| NA | 3rd Qu.:100.42 | 3rd Qu.:4.000 | 3rd Qu.:4.100 | 3rd Qu.:5059 | |
| NA | Max. :110.00 | Max. :6.000 | Max. :6.300 | Max. :9121 |
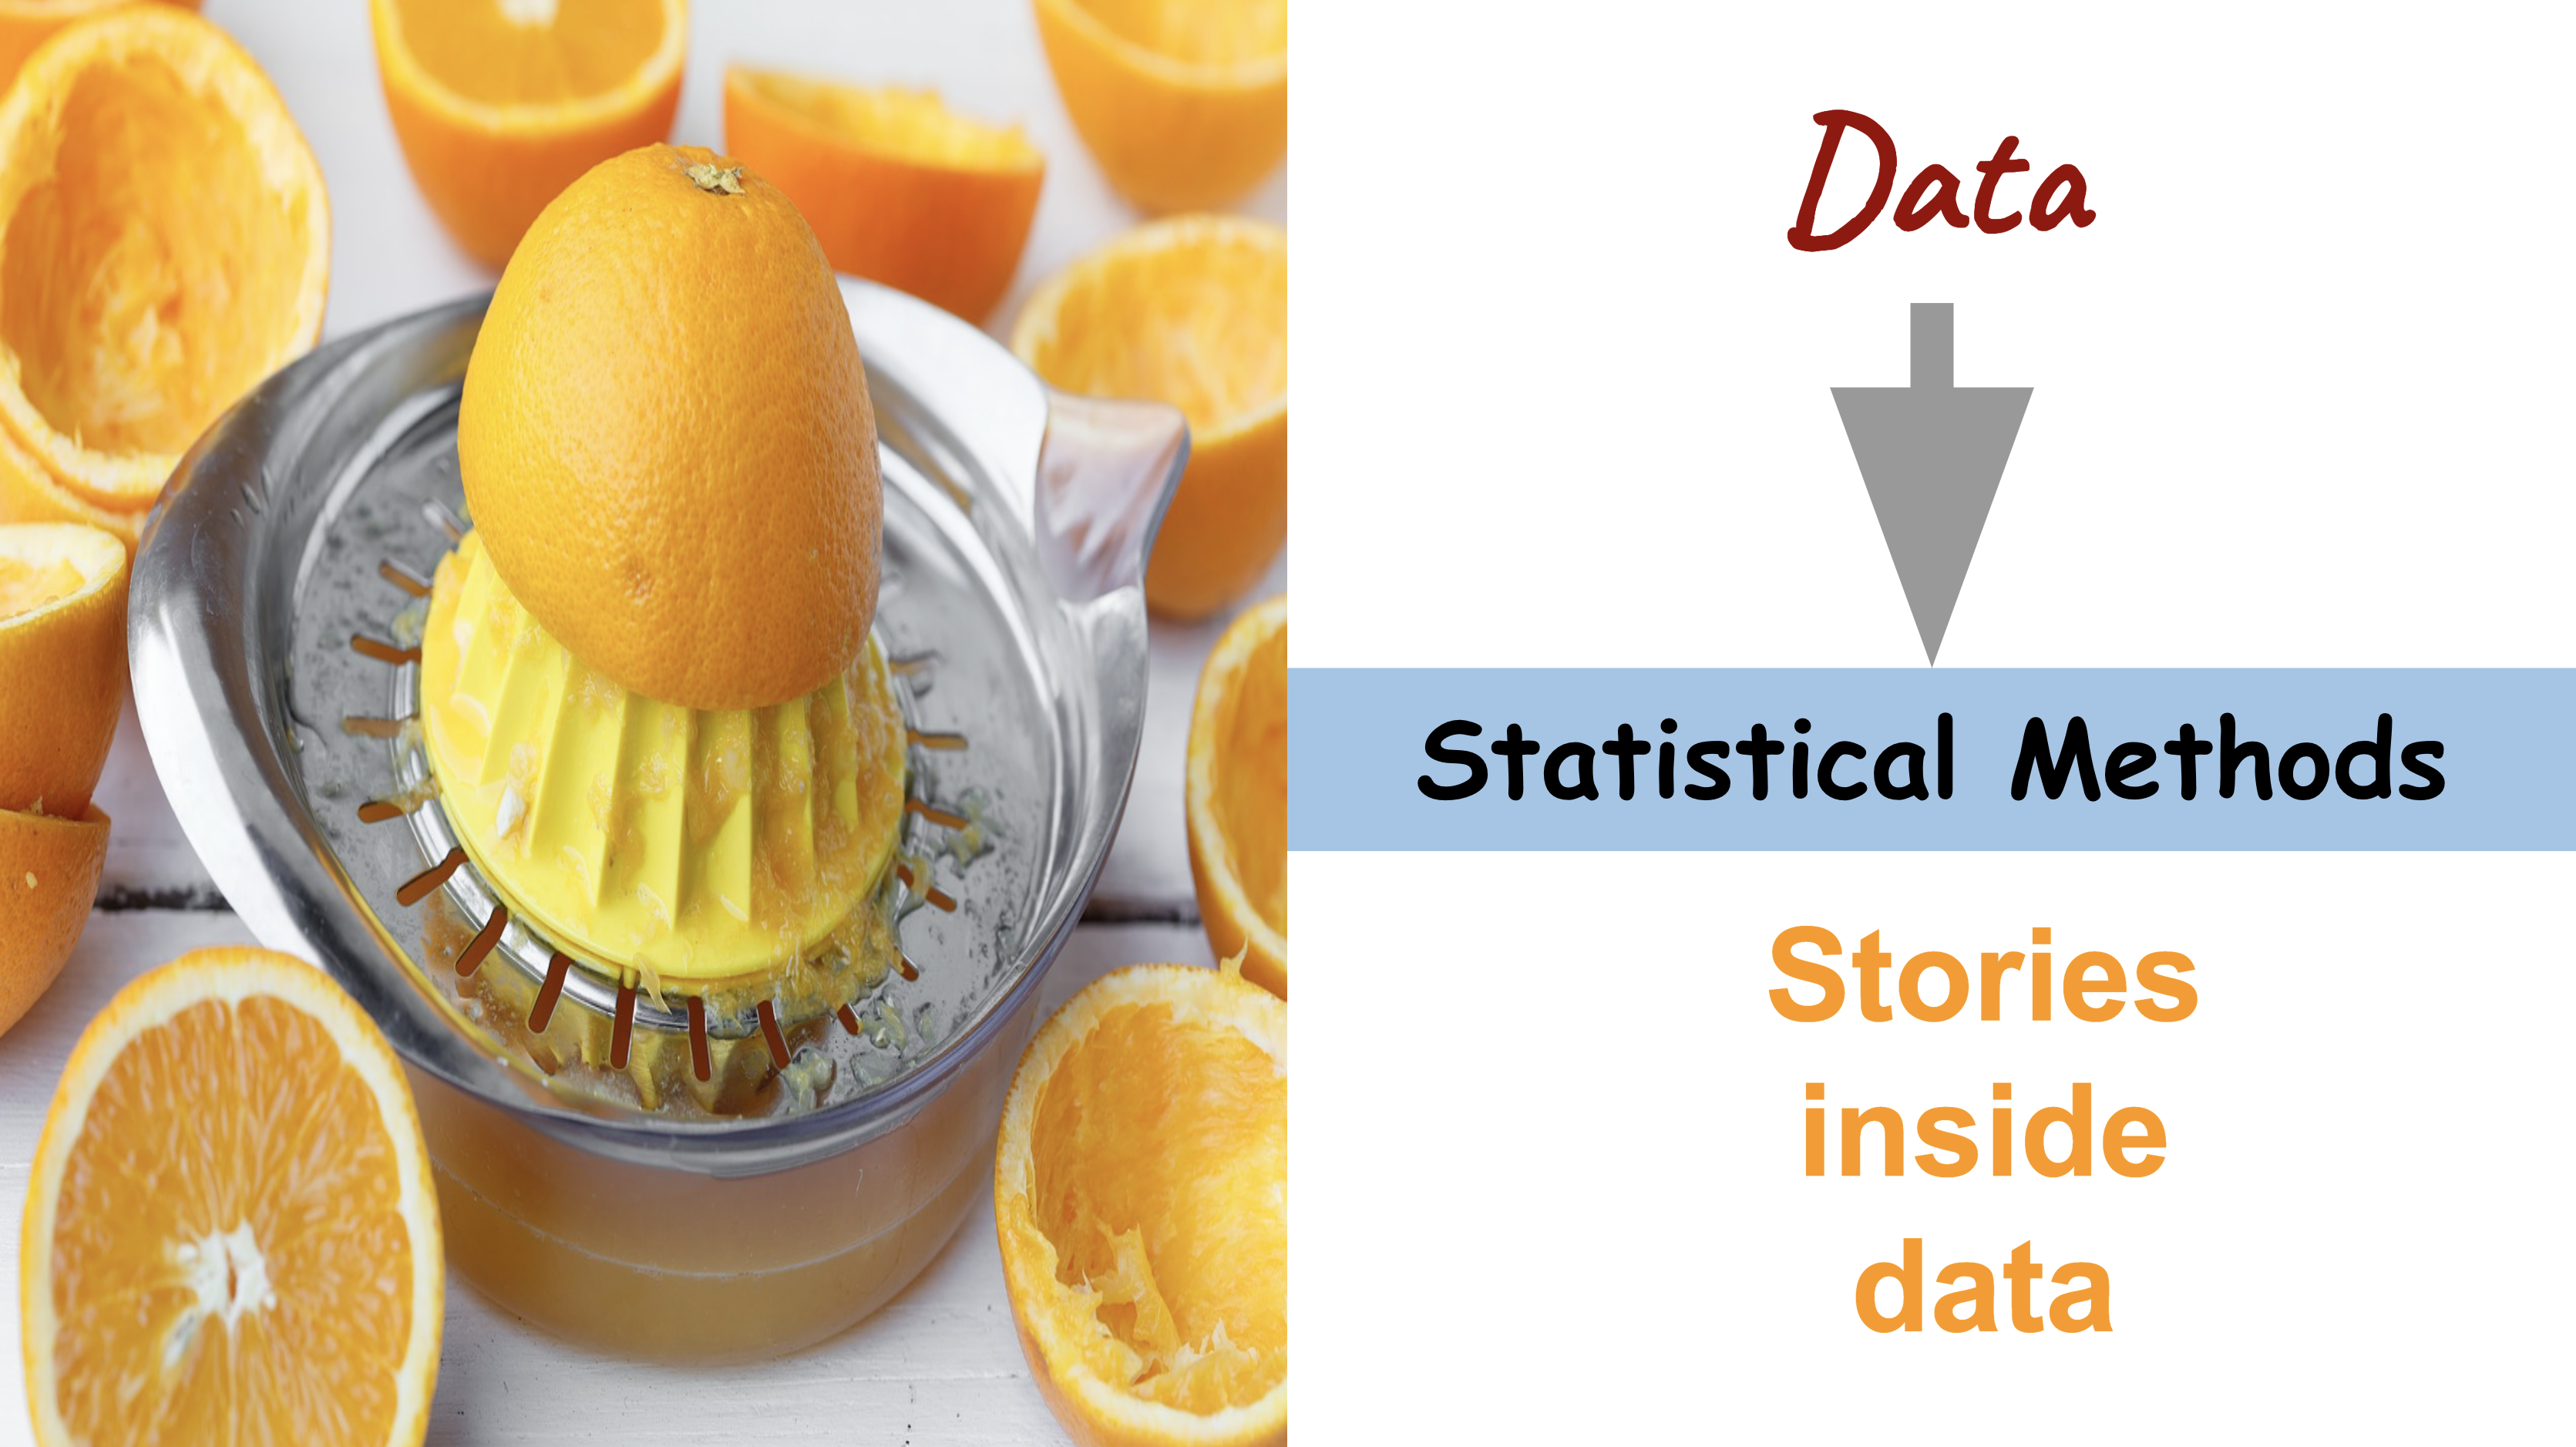
The science of collecting, organizing, and analyzing data, and presenting, and interpreting and interpreting the results derived from that data to gain insights and make informed decisions.
Presenting Data: Example
https://thiyangt.github.io/dsjobtraker_dashboard_mc/#top-software-and-skills
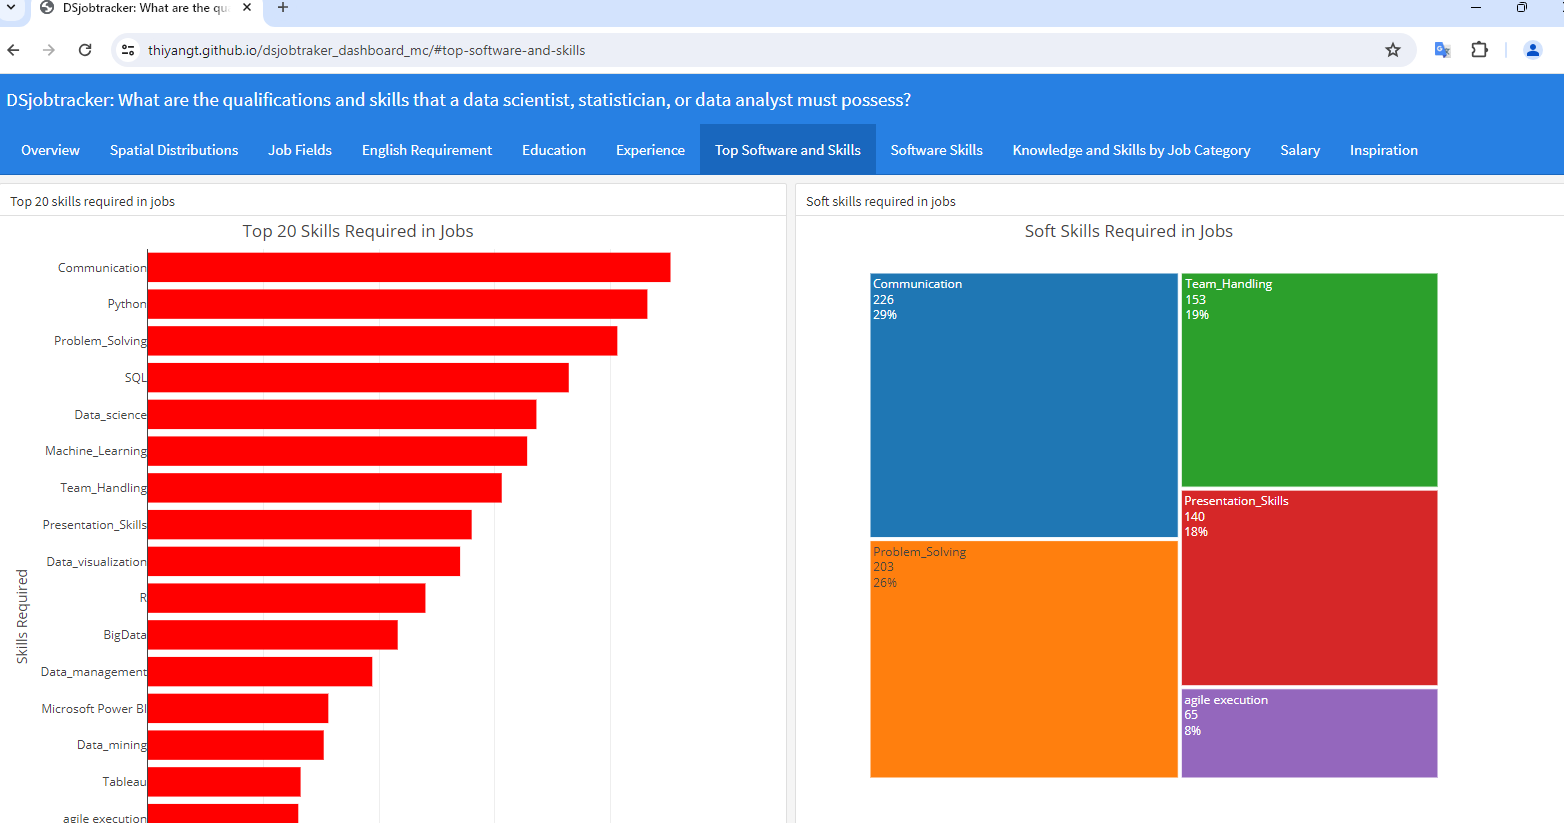
The science of collecting, organizing, and analyzing data, and presenting, and interpreting results derived from that data to gain insights and make informed decisions.
The science of collecting, organizing, and analyzing data, and presenting, and interpreting results derived from that data to gain insights and make informed decisions.
When you analyze data and gain insights, you’re uncovering patterns, trends, or meaningful information.
Example:
From the sales data, the company gained insights into customer behavior — such as which products were most popular in different regions.
The science of collecting, organizing, and analyzing data, and presenting, and interpreting results derived from that data to gain insights and make informed decisions.
“Informed” means based on knowledge, facts, or awareness.
When we say “informed decisions,” it refers to choices made after carefully considering relevant information or data, rather than guessing or relying on assumptions.
Outline
What is statistics?
Where do we use statistics?
Why do we need statistics?
Outline
What is statistics?
Where do we use statistics?
Why do we need statistics?
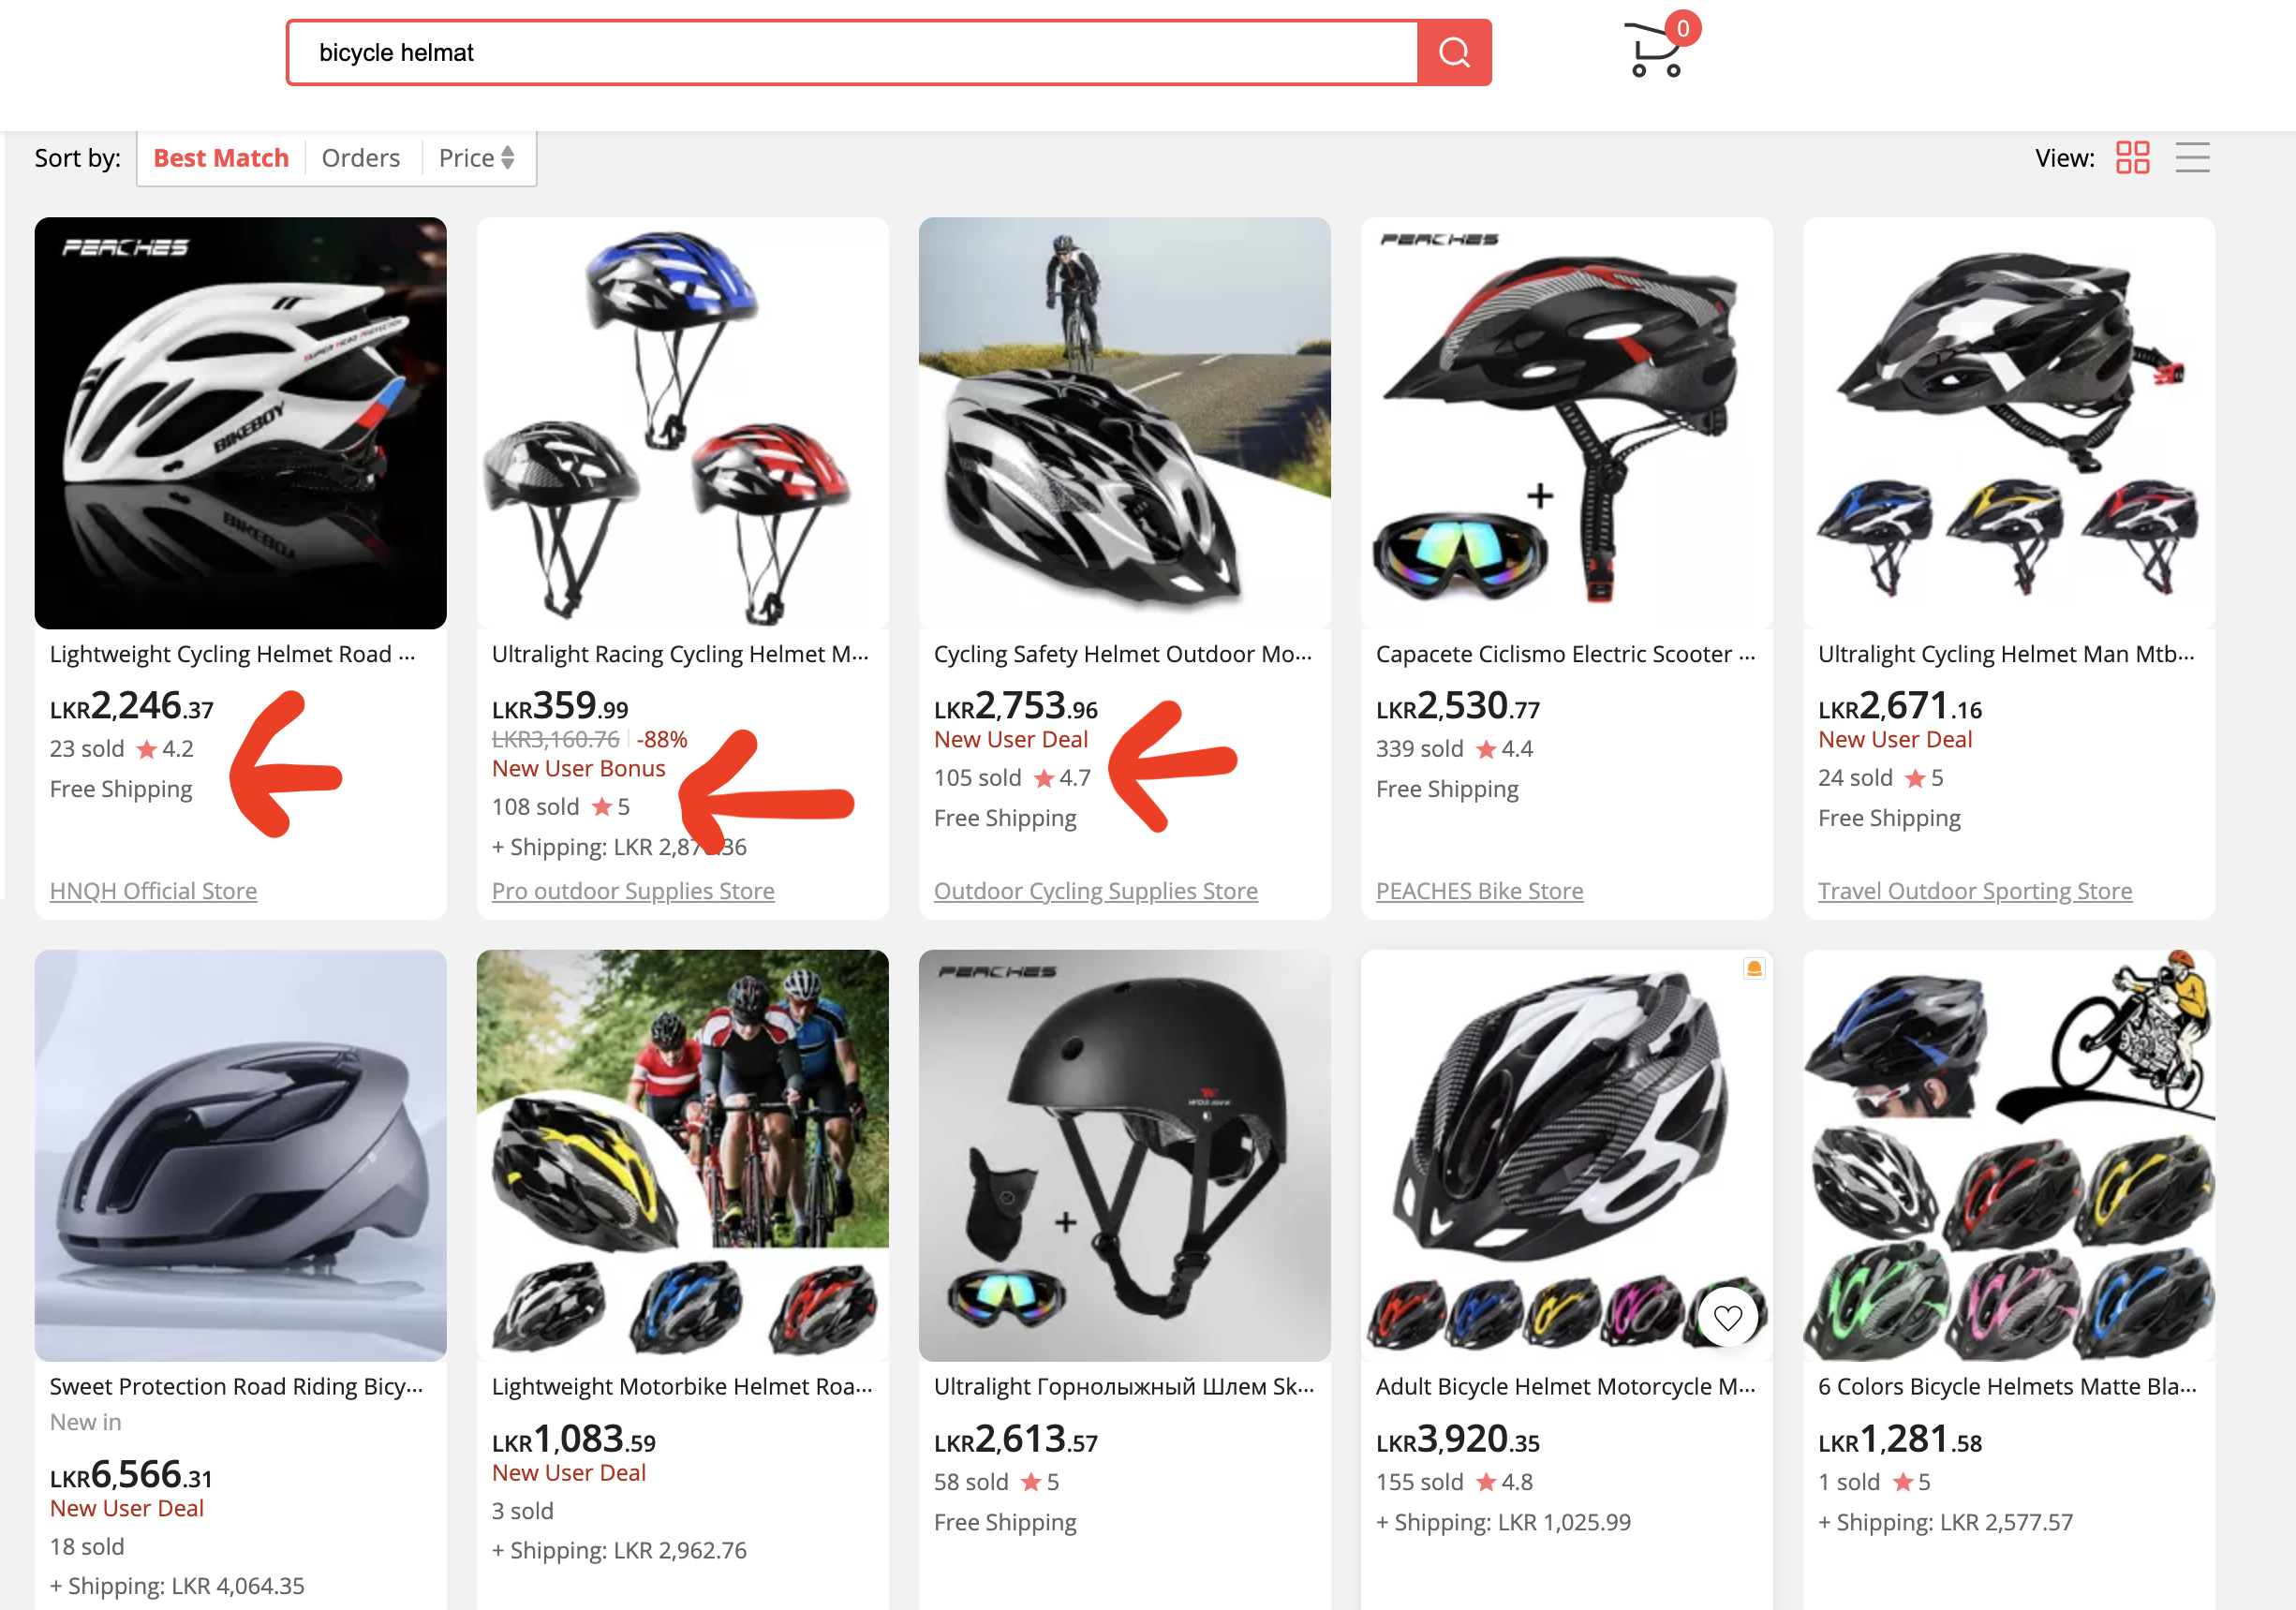
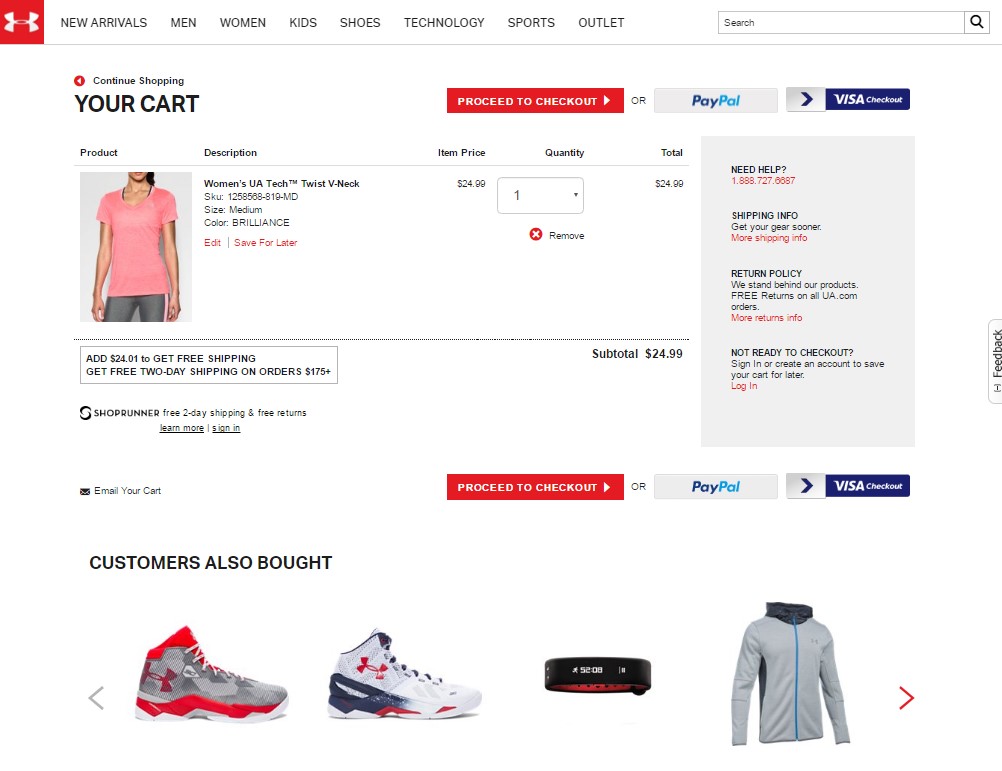
Your turn
How often do you find yourself relying on statistics in your daily routines or decision-making processes?
Could you provide a few examples of how you utilize statistical information?
10:00
Applications of statistics in different fields
| Terminology | Field |
|---|---|
| Epidemiology | The study and analysis of the patterns, causes and effects of health and disease conditions |
| Astrostatistics | Applies statistical analysis to the understanding of astronomical data |
| Biostatistics | Studies biological phenomena |
| Demography | Statistical study of all populations |
| Social statistics | Study human behavior in a social environment |
| Chemometrics | Science of extracting information from chemical systems by data-driven means |
| Terminology | Description |
|---|---|
| Actuarial statistics | Discipline that deals with assessing the risks in insurance and finance field. |
| Forensic statistics | Studies DNA testing results |
| Spatial statistics | Analysis of spatial data |
| Econometrics | Uses economic theory, mathematics, and statistical inference to quantify economic phenomena. |
| Jurimetrics | Application of probability and statistics to law. |
| Psychometrics | Applies statistical methods to psychological measurements |
Outline
What is statistics?
Where do we use statistics?
Why do we need statistics?


Captured by Dr Thiyanga S. Talagala

#Learn to Travel. Travel to Learn.