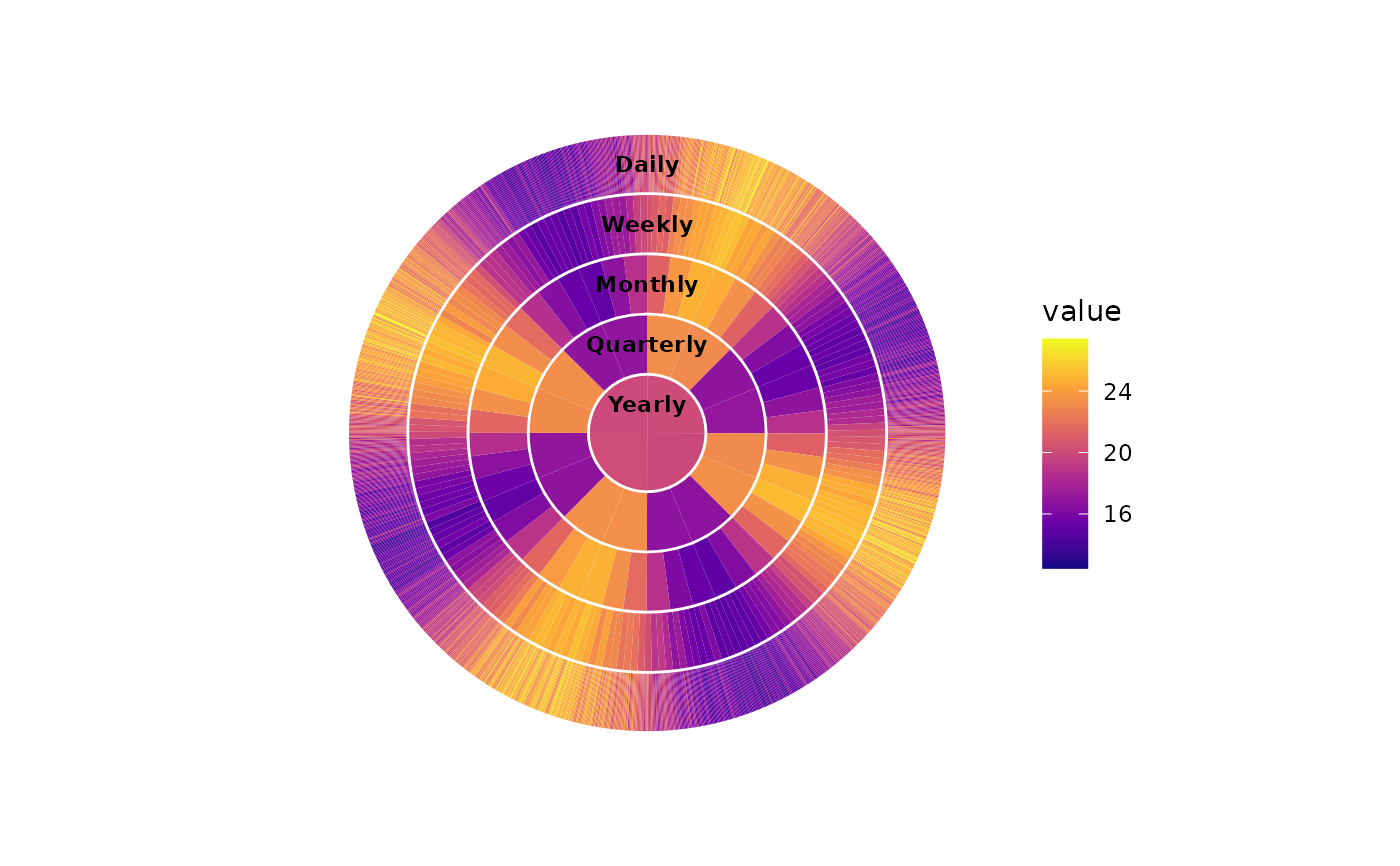
Aligned Temporal Hierarchical Spiral Plot
Source:R/temporal_hierarchical.R
temporal_hierarchical.RdVisualise a time series at multiple temporal resolutions using concentric rings with a common temporal coordinate system.
Usage
temporal_hierarchical(
  data,
  date,
  value,
  fun = mean,
  ring_width = 1,
  ring_gap = 0.05,
  na.value = "grey90",
  daily = TRUE,
  weekly = TRUE,
  monthly = TRUE,
  quarterly = TRUE,
  yearly = TRUE,
  direction = 1,
  start_angle = -pi/2
)
Arguments
- data
A data frame containing a date variable and a numeric variable.
- date
Unquoted name of the date column.
- value
Unquoted name of the numeric variable to visualise.
- fun
Aggregation function used for weekly, monthly, quarterly, and yearly aggregation. Defaults to
mean.- ring_width
Width of each ring. Defaults to
1.- ring_gap
Gap between rings. Defaults to
0.05.- na.value
Colour used for missing values. Defaults to
"grey90".- daily
Logical; draw the daily ring. Defaults to
TRUE.- weekly
Logical; draw the weekly ring. Defaults to
TRUE.- monthly
Logical; draw the monthly ring. Defaults to
TRUE.- quarterly
Logical; draw the quarterly ring. Defaults to
TRUE.- yearly
Logical; draw the yearly ring. Defaults to
TRUE.- direction
Direction of the temporal axis.
1produces a clockwise direction and-1produces an anticlockwise direction.- start_angle
Starting angle in radians. Defaults to
-pi / 2, placing the beginning of the series at the top.
Details
The outer ring represents daily observations, followed inward by weekly, monthly, quarterly, and yearly observations. Temporal boundaries are aligned across all rings.
All temporal levels use a common angular coordinate based on the complete date range. Consequently, observations at different temporal resolutions are spatially aligned.
For example, the monthly January ring occupies the same angular region as the corresponding daily observations, weeks, quarter, and year.
The outer-to-inner hierarchy is:
Daily
Weekly
Monthly
Quarterly
Yearly