Sri Lanka Dengue Atlas
Home
Spatial Distribution of Annual Dengue Cases by Districts and Year
Time Series Visualizations by District and Year
Seasonal Time Series Visualizations
Summary of District-wise Dengue Cases by Year
Population
About
Time Series Visualizations by District and Year
1
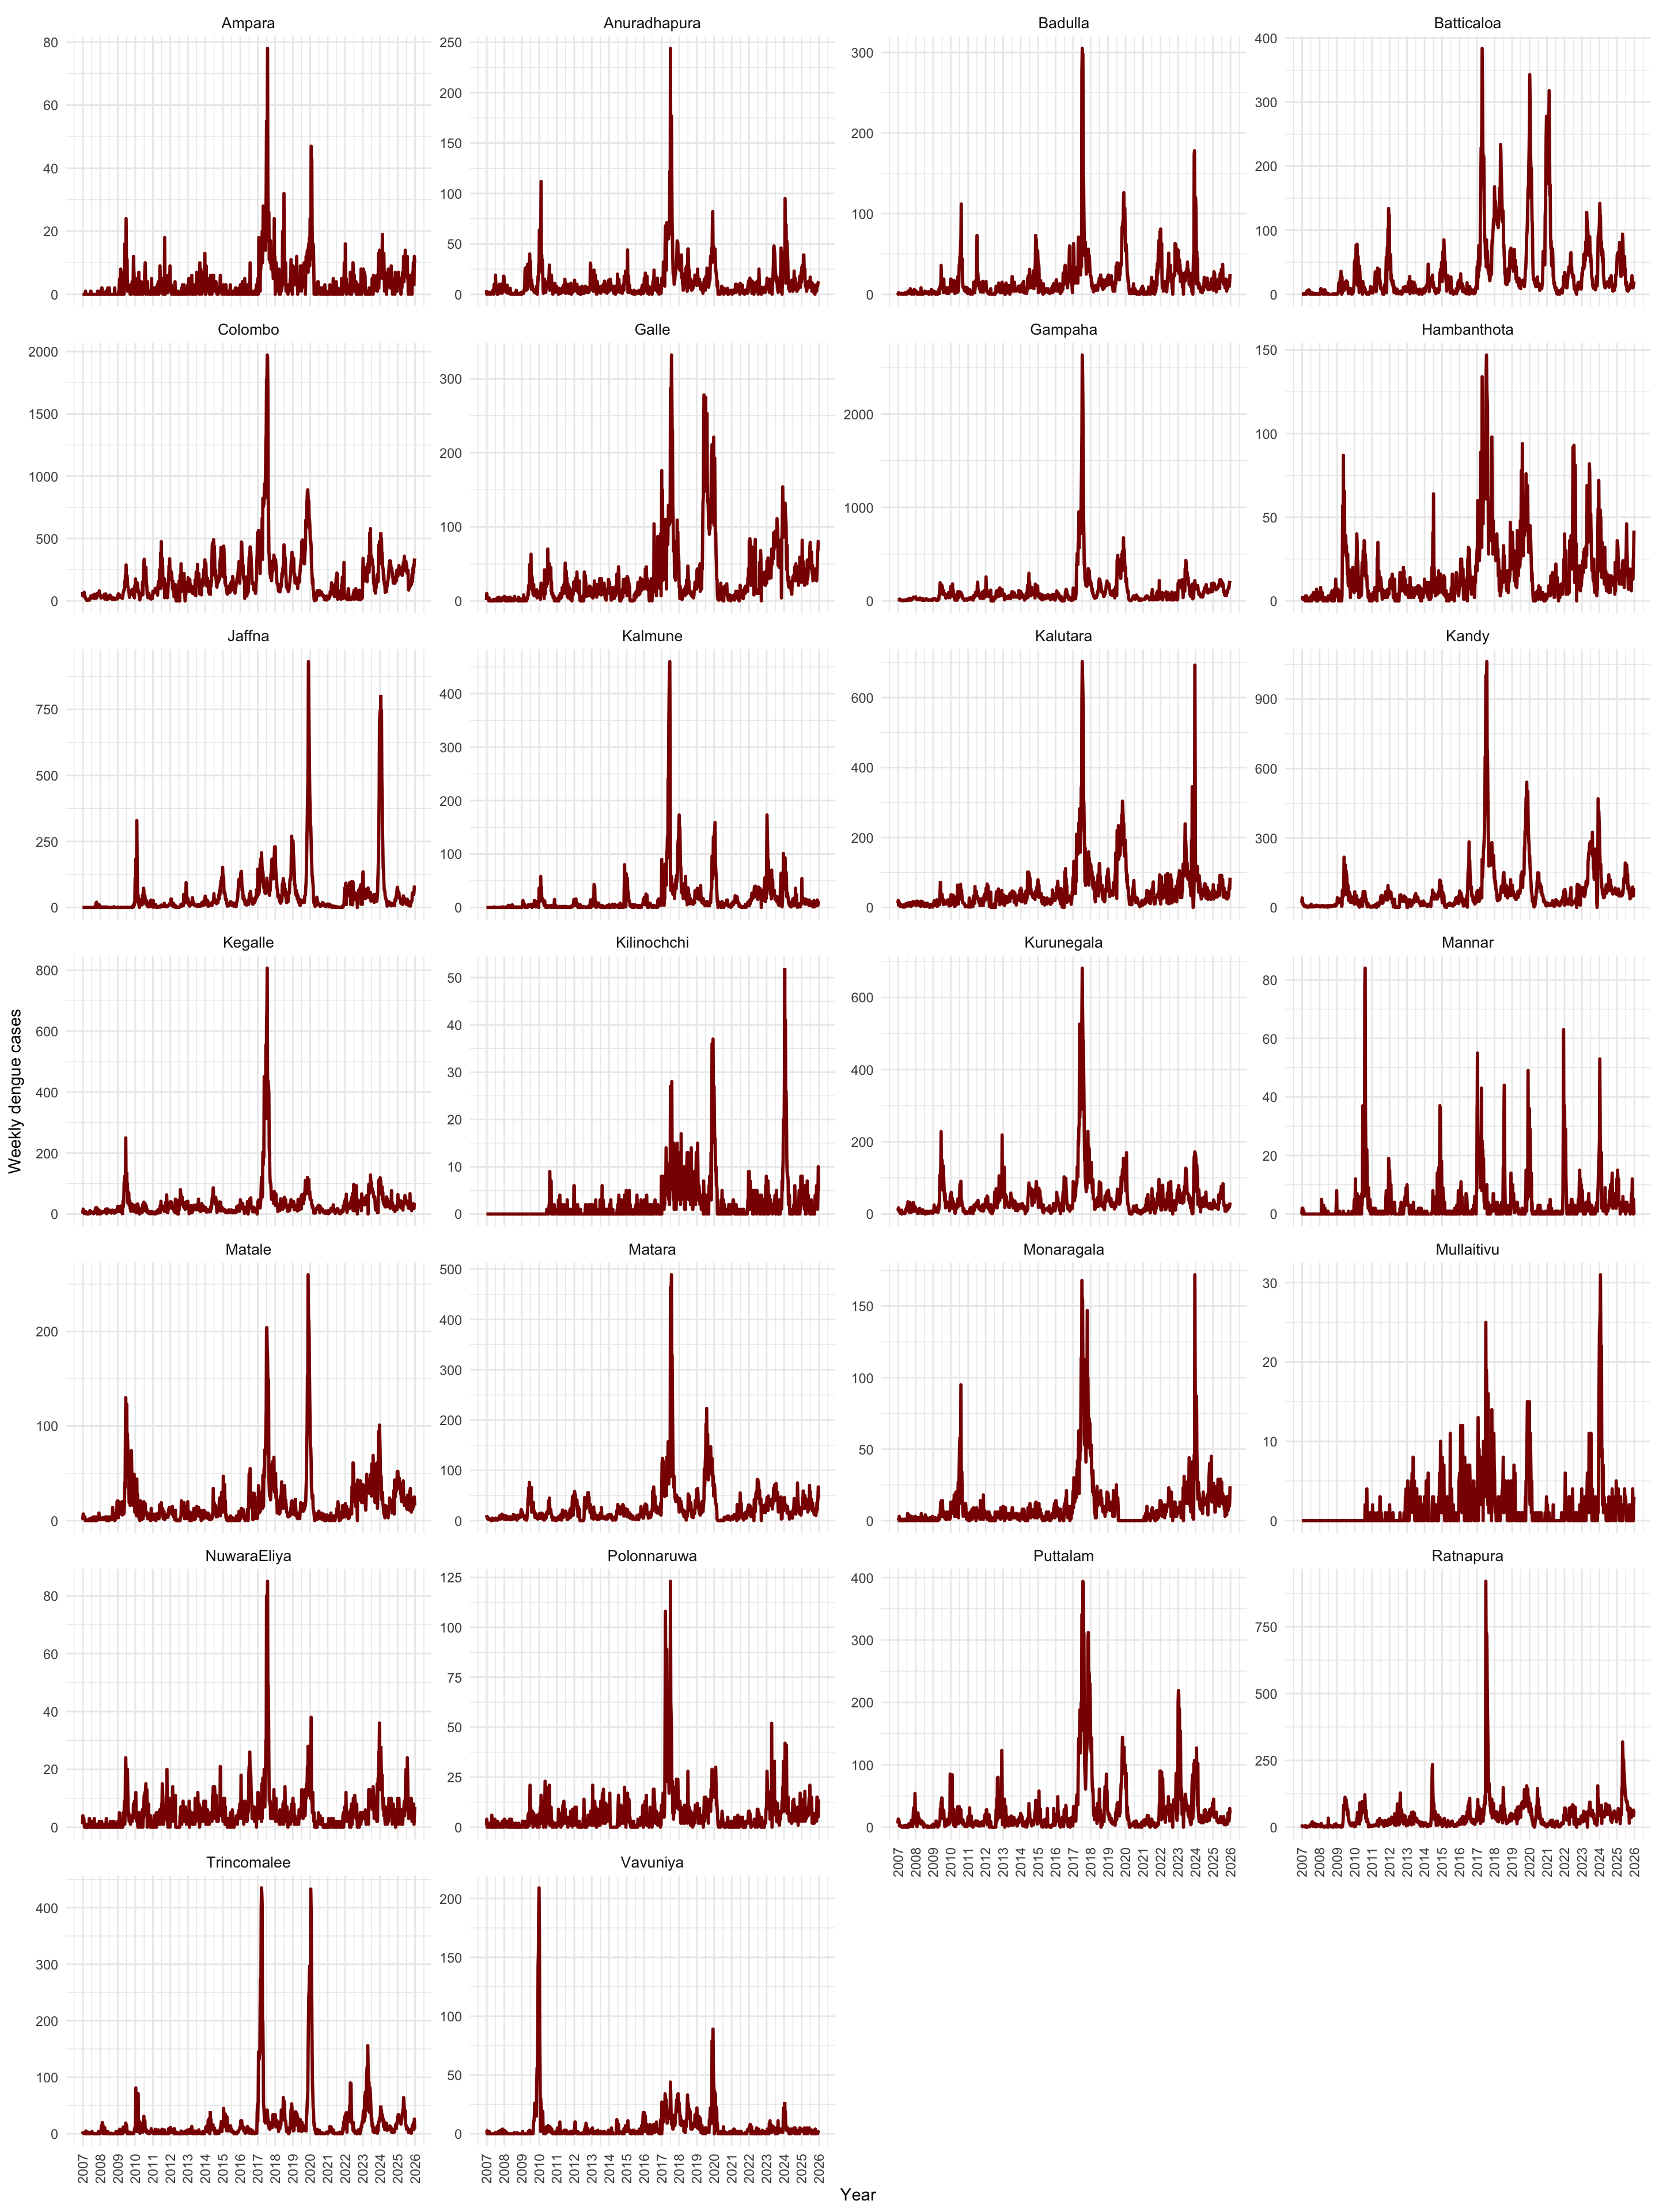
Weekly Dengue Cases by District
Note
Explore Interactive Dashboard
To zoom into district charts and statistics:
Open Dashboard
Figure 4: Time series plots of weekly dengue cases by districts