Exercise 5 Data Visualization with R: qplot
5.1 Lecture slides
5.2 Visualizing the diamonds dataset using R
This question is based on diamonds dataset in ggplot2 package. Load the ggplot2 package and the diamonds dataset using the following command.
library(ggplot2)
data("diamonds")
To find out what information there is about the dataset, you can run the command:
help(diamonds)There are over 50000 observations and 10 variables in the diamond dataset. Write down the R codes to reproduce the following graphic outputs.
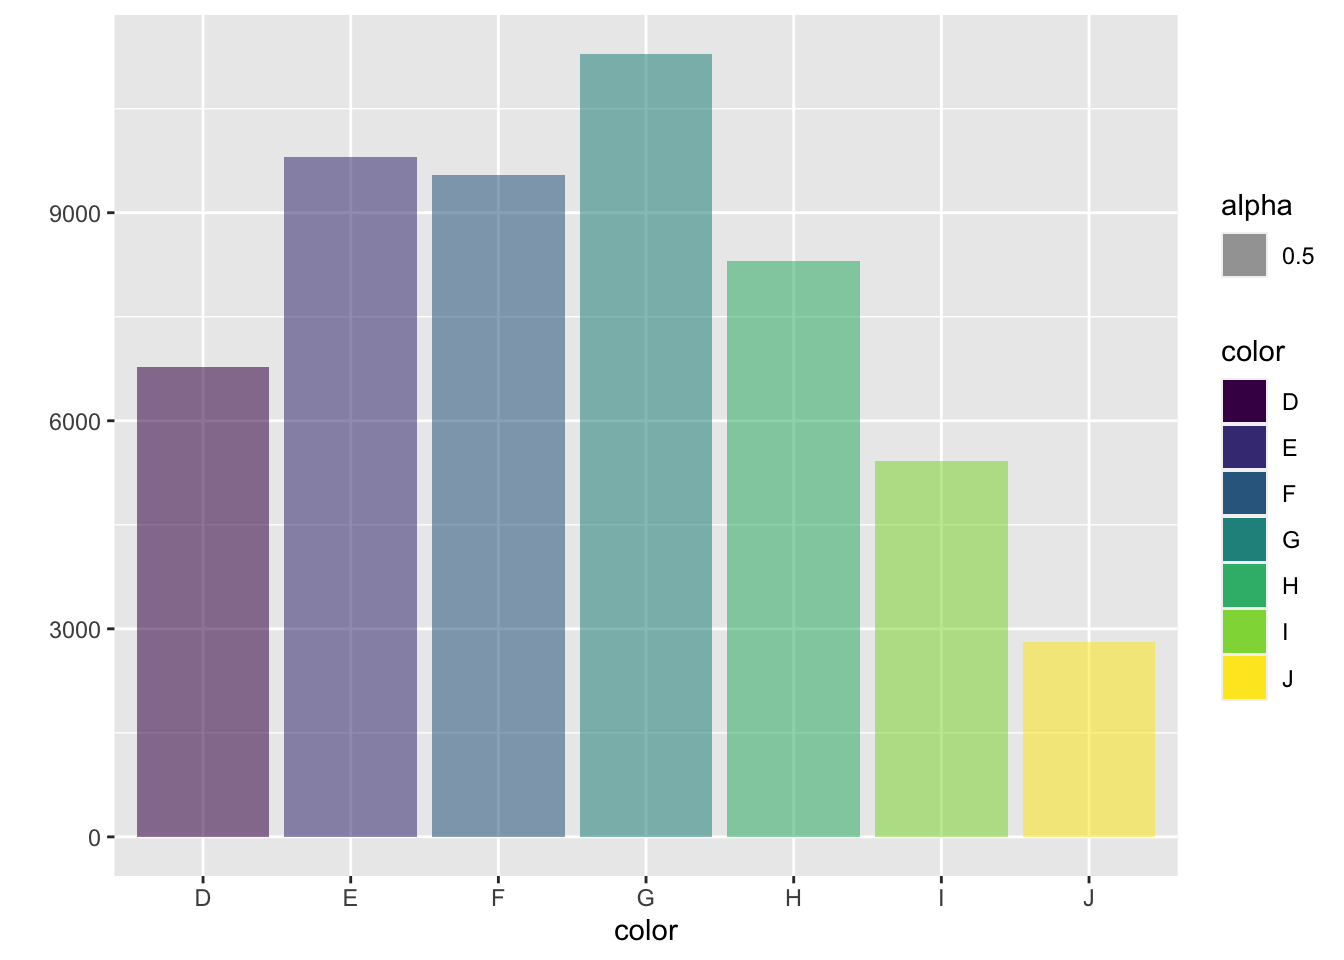
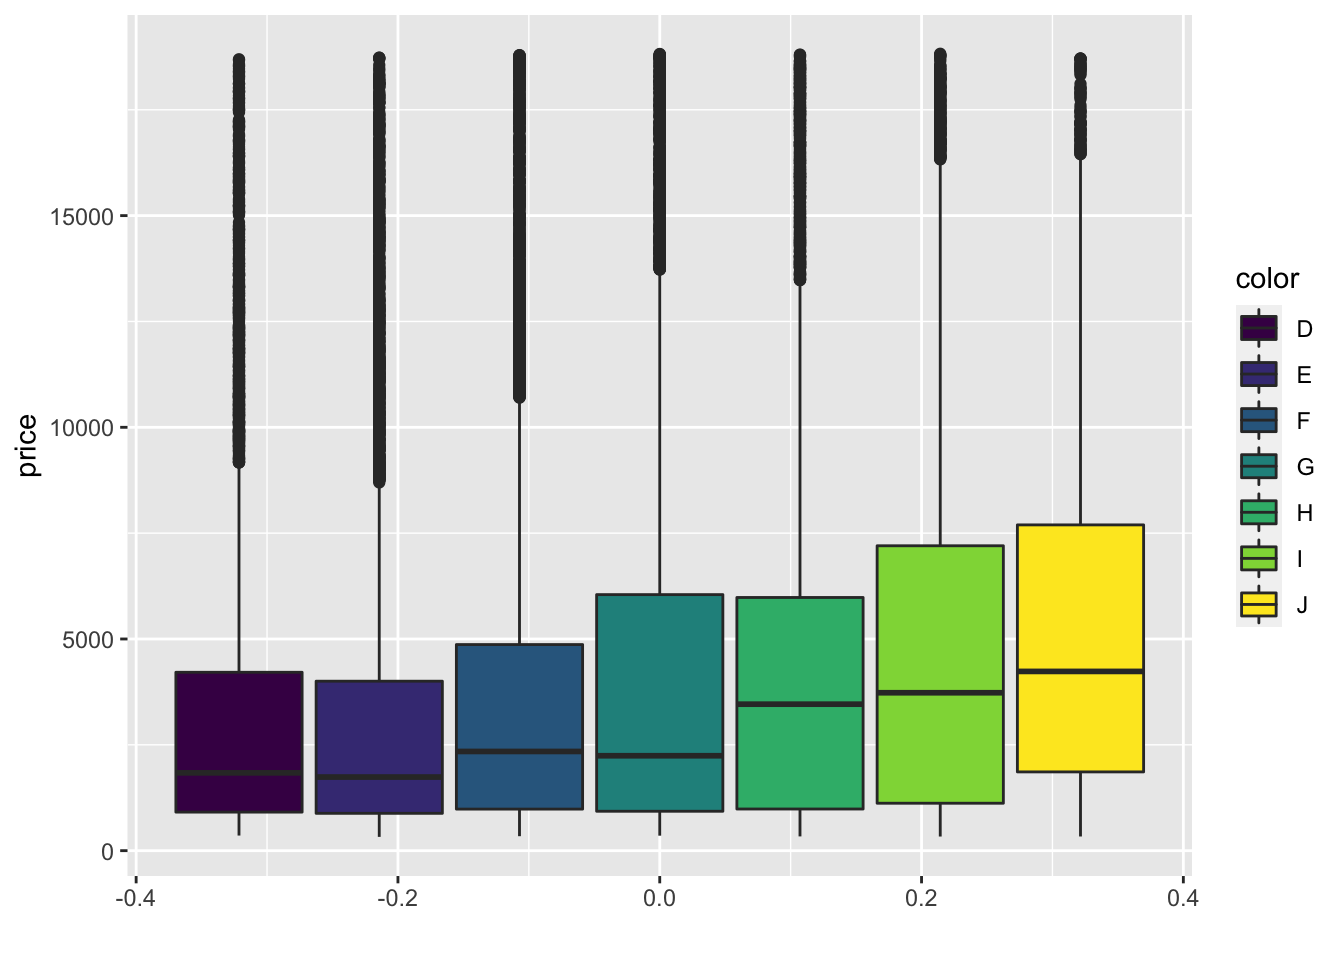
Help: use fill option to assign colours and alpha option to add transparency to the bars.
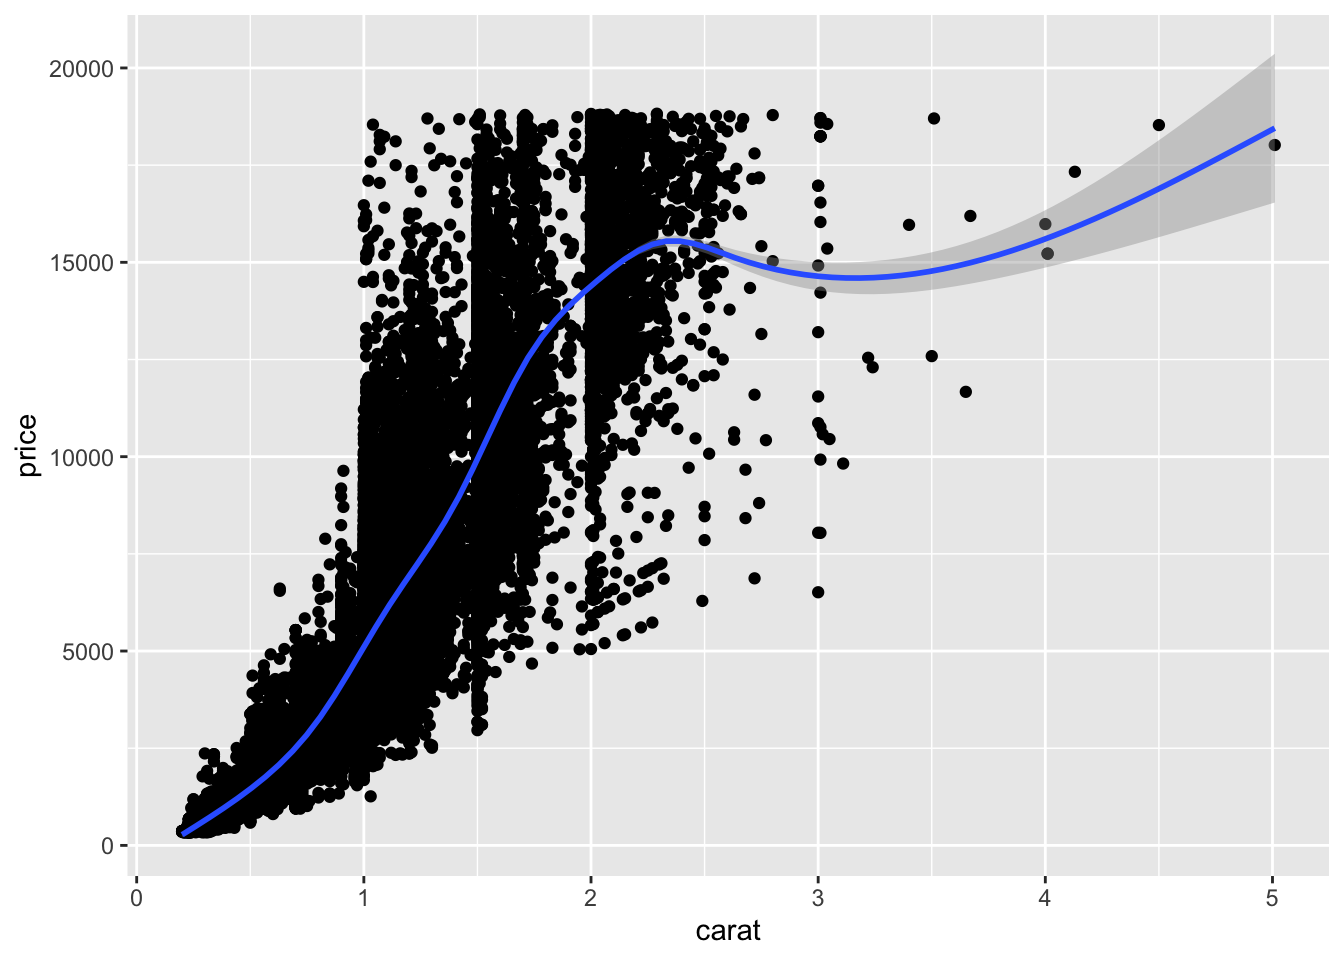
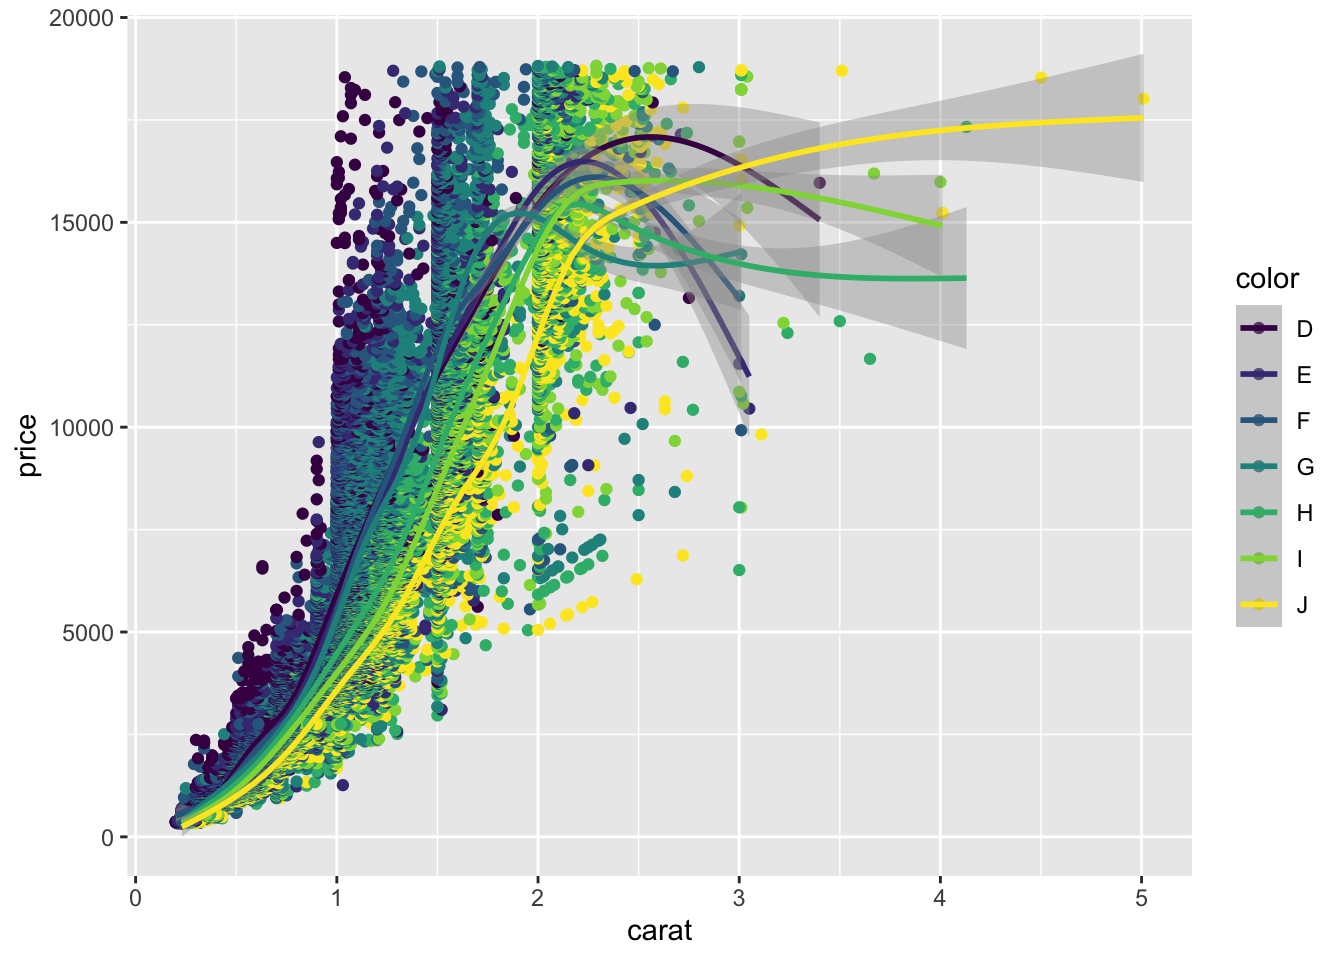
Help: use geoms, point and smooth.
5.3 Answers
Section 4.3
library(ggplot2)
data(diamonds)
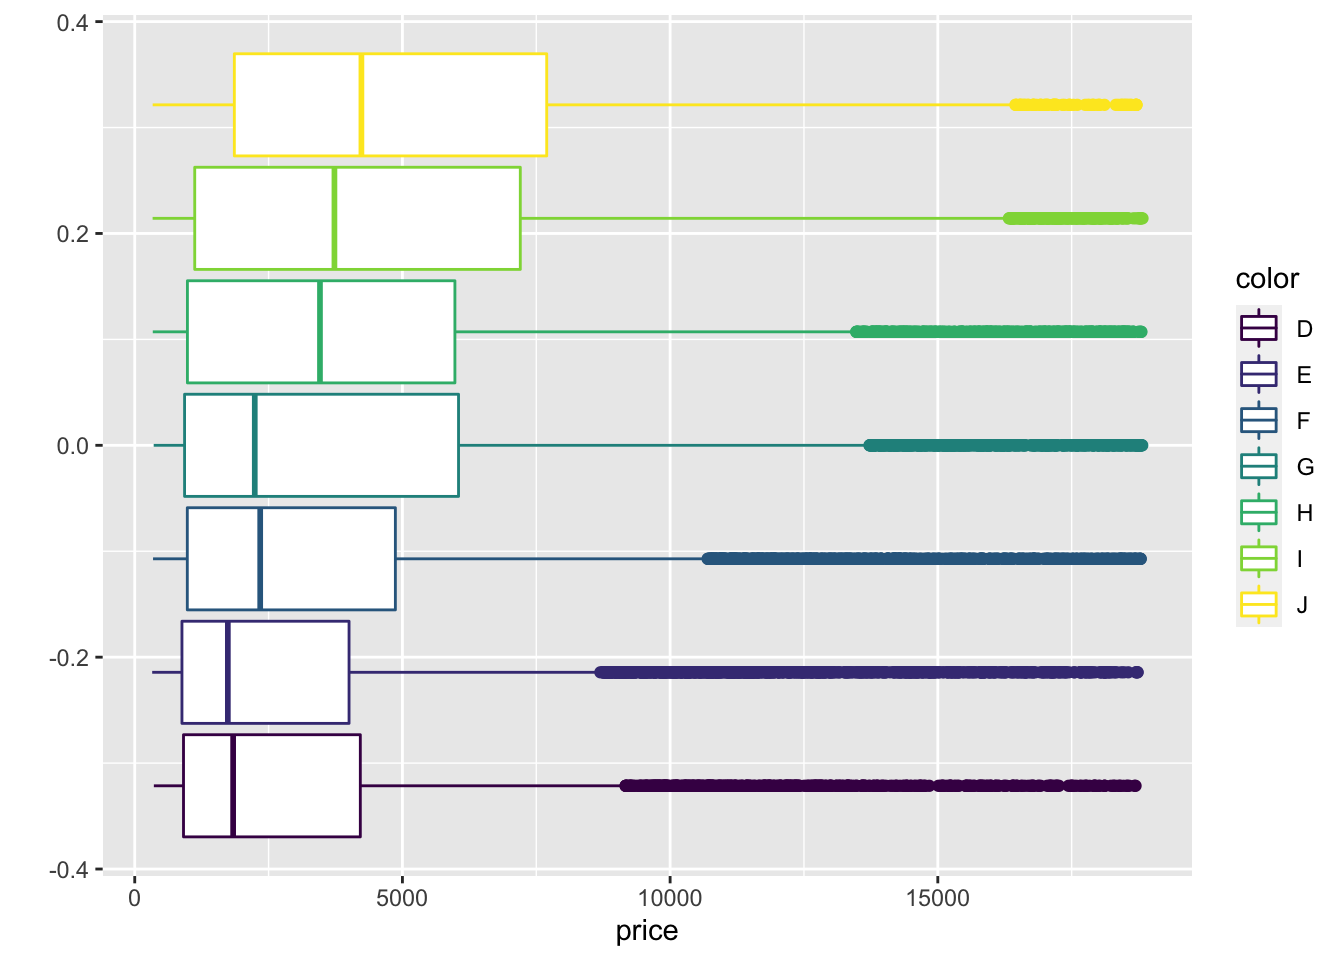
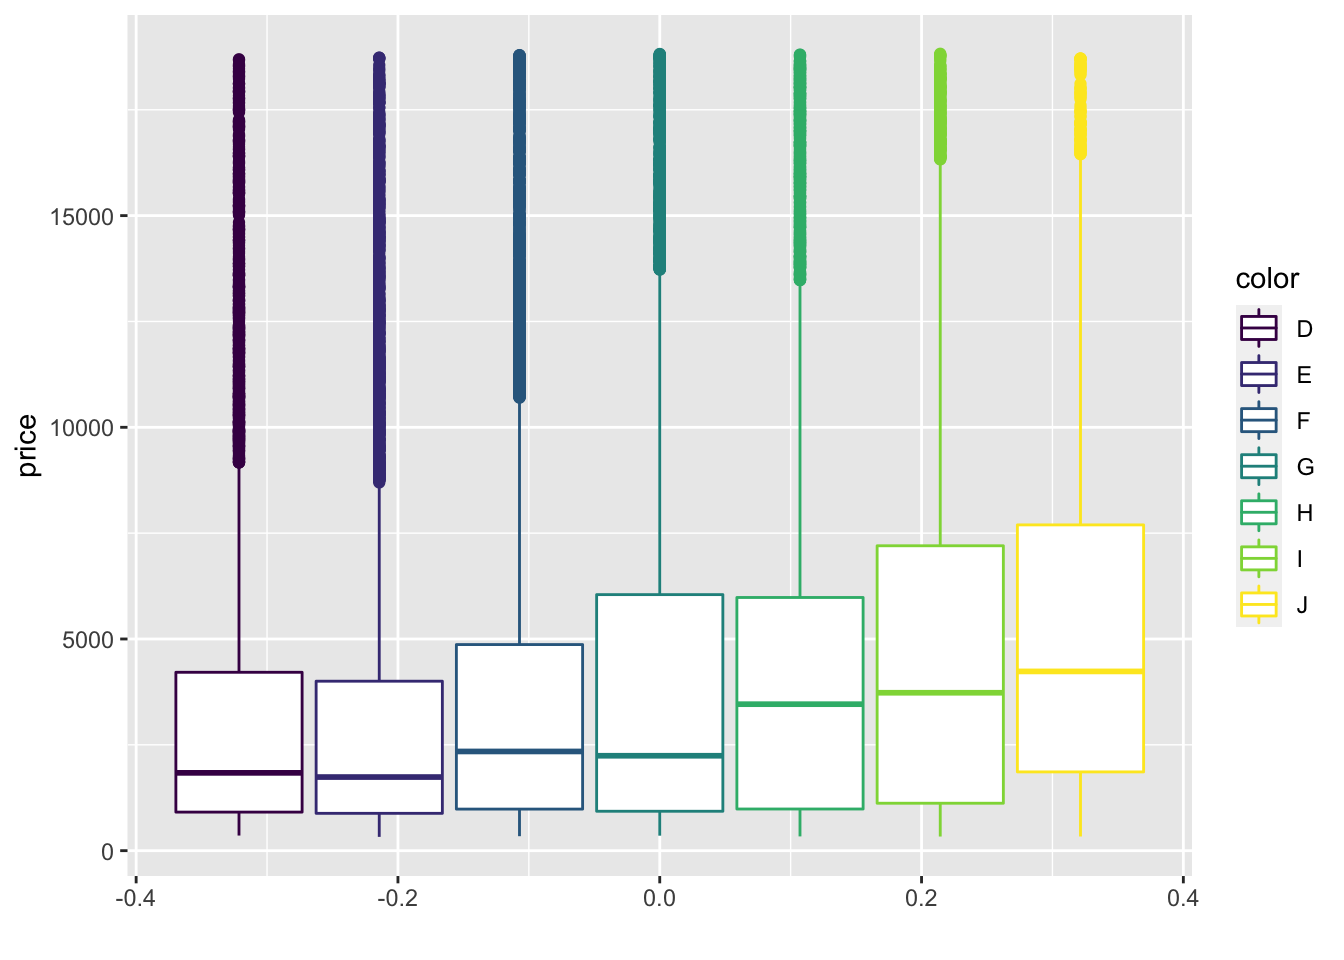
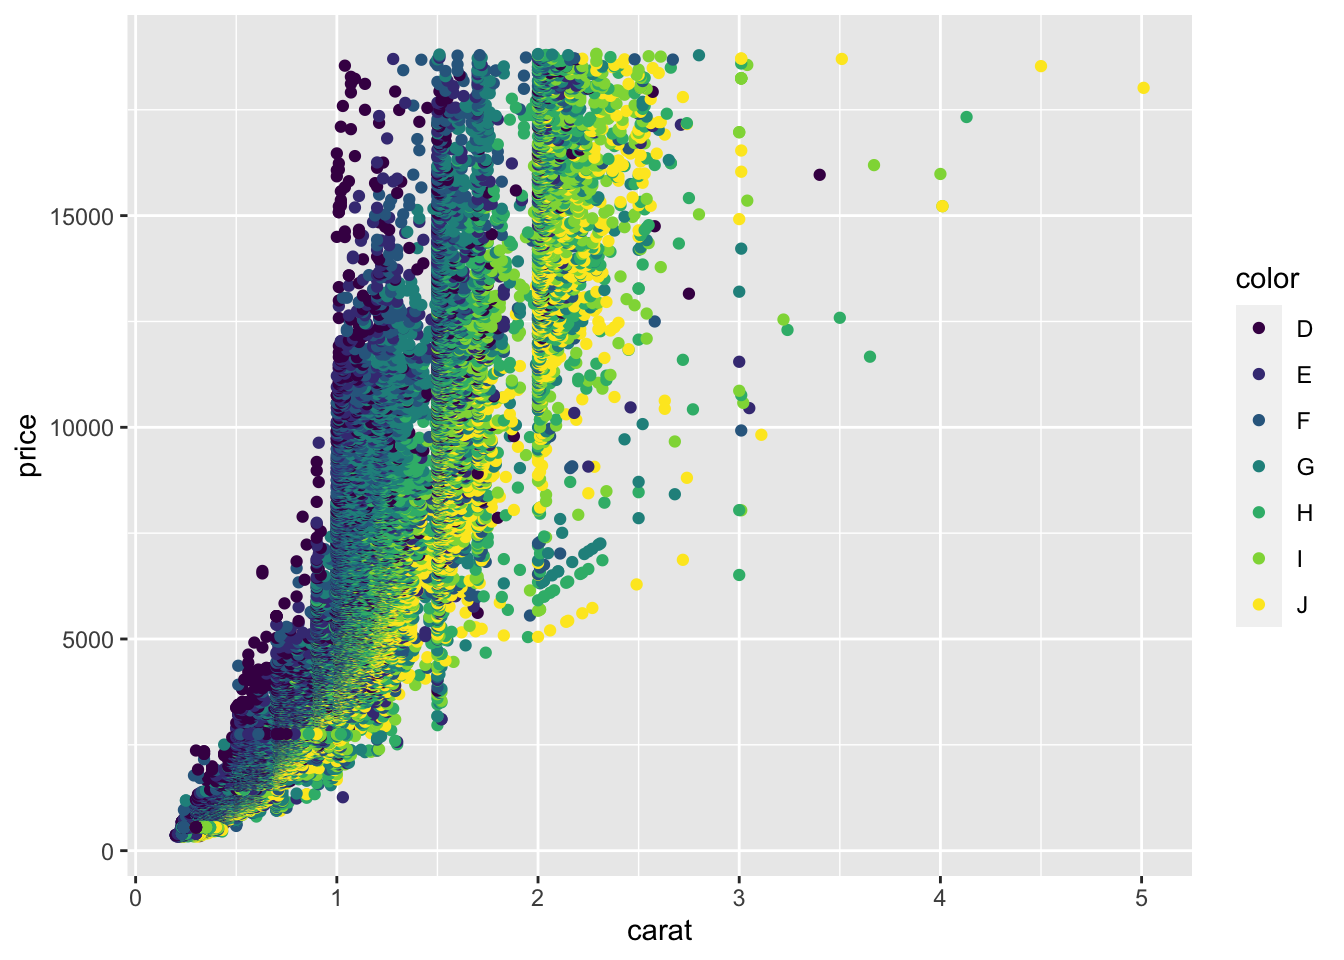
qplot(color, data = diamonds, geom = "bar", fill = color, alpha = 0.5) qplot( data = diamonds, carat, price, geom = c("point", "smooth"))qplot(data = diamonds, x = price, color = color, geom = 'boxplot' )qplot(data = diamonds, y = price, color = color, geom = 'boxplot' )qplot(data = diamonds, y = price, fill = color, geom = 'boxplot' )qplot( data = diamonds, carat, price, colour=color, geom = "point")qplot( data = diamonds, carat, price, colour=color, geom = c("point", "smooth"))