Primary vs Secondary Data
Primary Data
Primary data refers to information collected directly by the researcher.
This data is gathered specifically to address the researcher’s current problem or objective, tailored to meet the specific requirements of a particular study.
Methods of collecting primary data
Secondary Data
- Secondary data refers to information that has already been collected, compiled, and published by others for purposes different from the researcher’s current study.
Methods of collecting secondary data
Why Secondary Data?
Cost-Effective (not always)
Time-saving
Preliminary Research: It serves as a valuable resource for preliminary research or background studies, helping to identify gaps in knowledge, formulate hypotheses, and refine research questions.
Historical Analysis: Enables researchers to conduct historical analyses and understand past trends, events, and behaviors, which can inform present and future research directions.
Validation: Secondary data can be used to validate findings from primary data
Observational Studies vs Experimental Study
Observational Study
The researcher observes and collects data without manipulating variables.
Experimental study
The researcher manipulates one or more variables (independent variables) and measures the effect on another variable (dependent variable).
Example for observational study vs experimental study
Research question: “Investigate the effect of fertilizer A and B on chili crop yield.”
Following is how two researchers started the data collection to answer the research question.
Researcher 1
Step 1: Population: Identify two groups of chili farmers based on the fertilizer they use.
Group A: Farmers using fertilizer A.
Group B: Farmers using fertilizer B.
Step 2: Data collection: Collect data on chili crop yield from both groups at the end of the growing season.
Researcher 2
Step 1: Randomization: Randomly assign plots of land to receive either fertilizer A or fertilizer B. Same seed variety is used.
Step 2: Control Conditions: Ensure all other conditions (water, sunlight, humidity, soil type) are kept constant across all plots. Use consistent pest management practices and ensure uniform planting and harvesting techniques.
Step 3: Data Collection: Measure the chili crop yield from each plot at the end of the growing season.
Here researcher 1 used observation study to collect data and researcher two use experimental study to collect data.
Population
The complete collection of individuals or objects that are of interest.
Example
We’re interested in studying the average height of all adults in a country, the population is all adult residents of that country.
Unit
A unit is a single member of the population. It could be an individual or an object.
Example
- Population
We’re interested in studying the average height of all adults in a country, the population is all adult residents of that country.
- Unit
In our example of studying adult height, each adult residing in the country would be a unit.
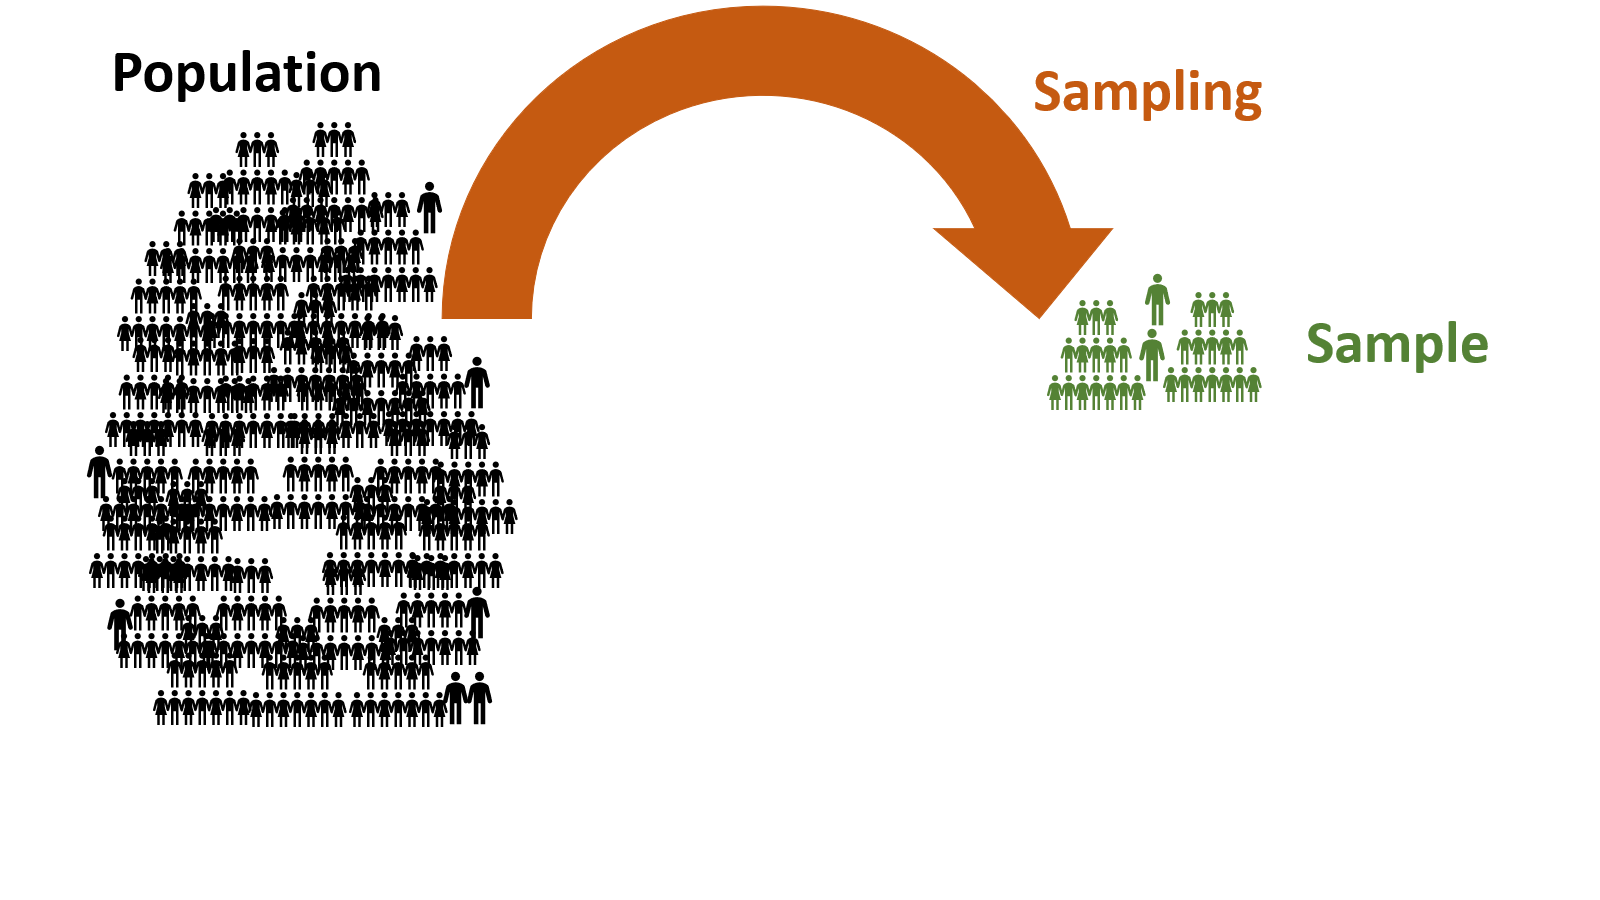
Sample
A subset of units in a population.
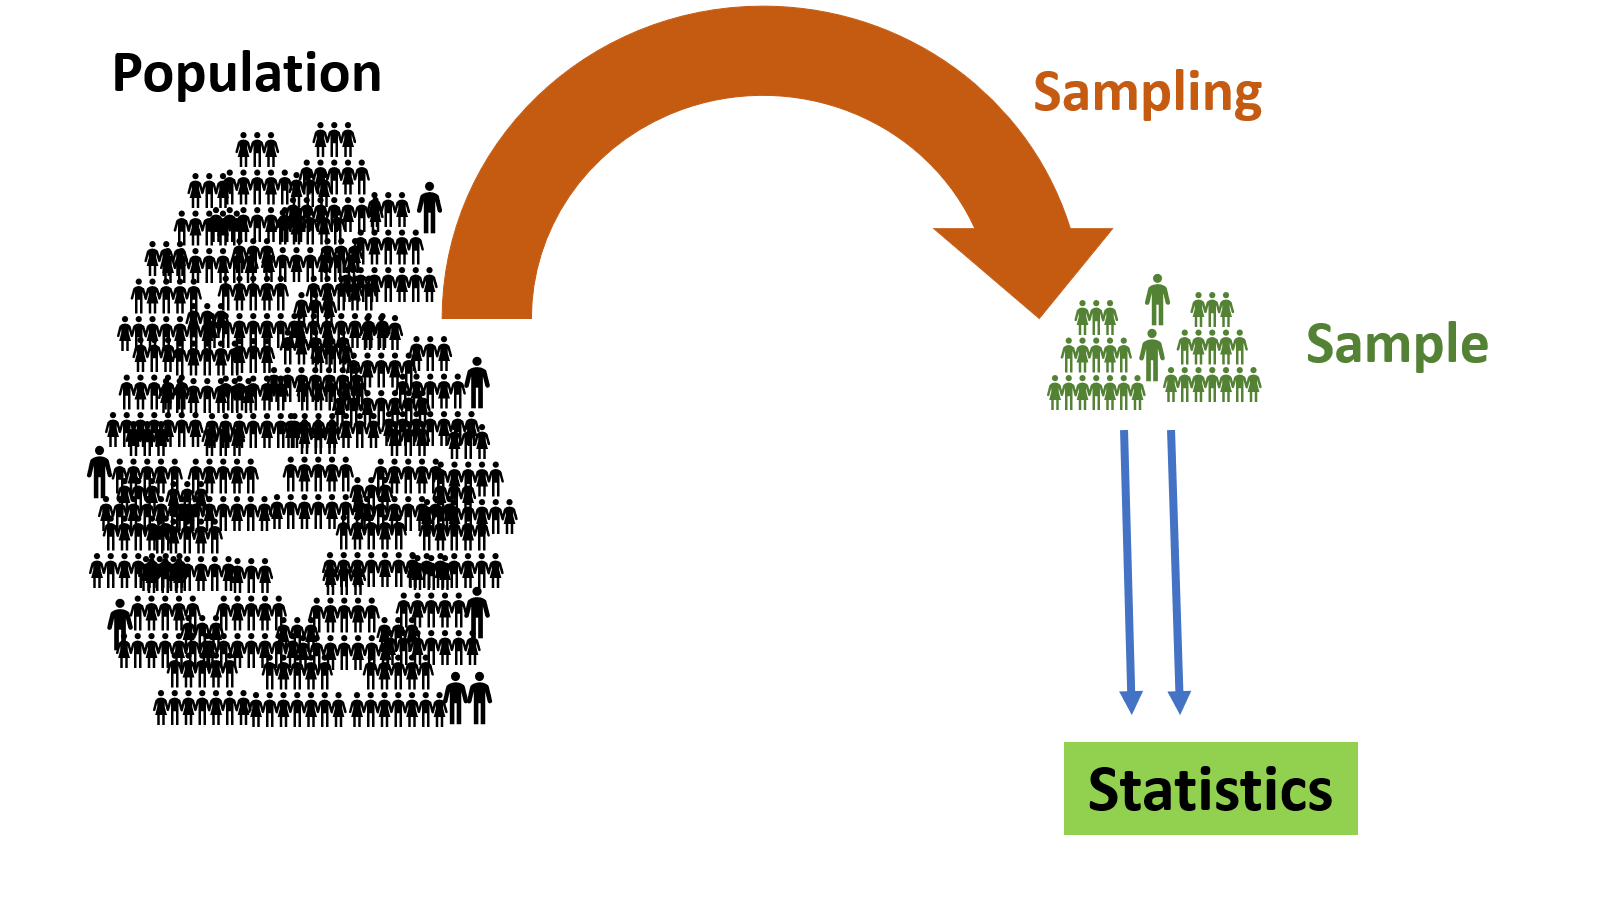
Sampling
Sampling is the process of selecting a subset of individuals or items from a population.
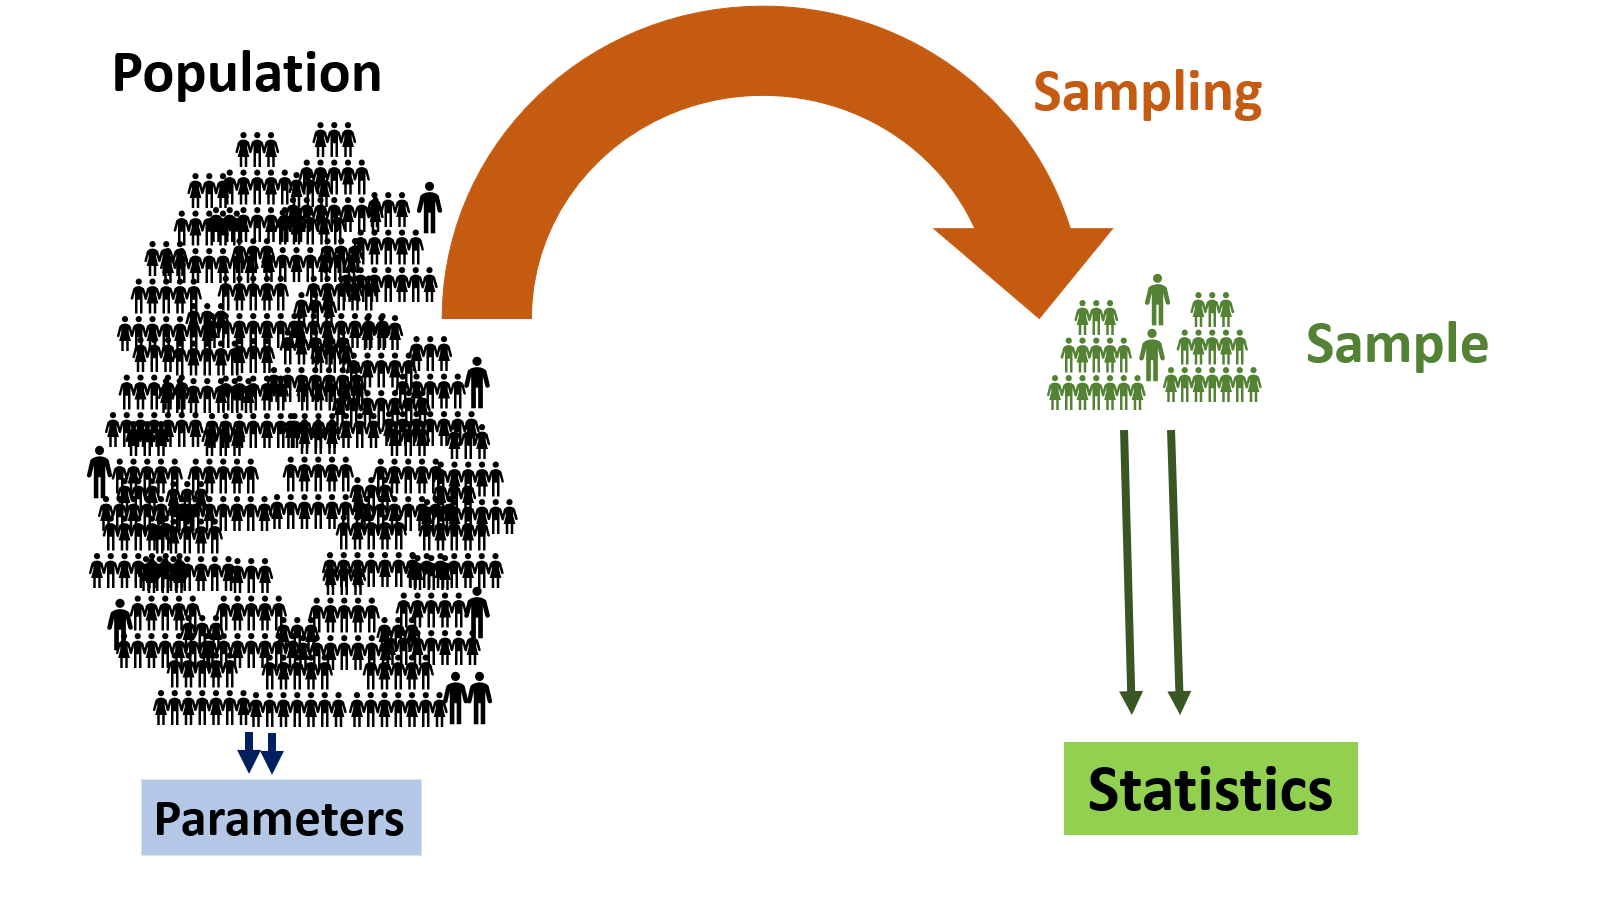
Statistics
A numerical summary of a sample.
Parameter
A numerical summary of a population.
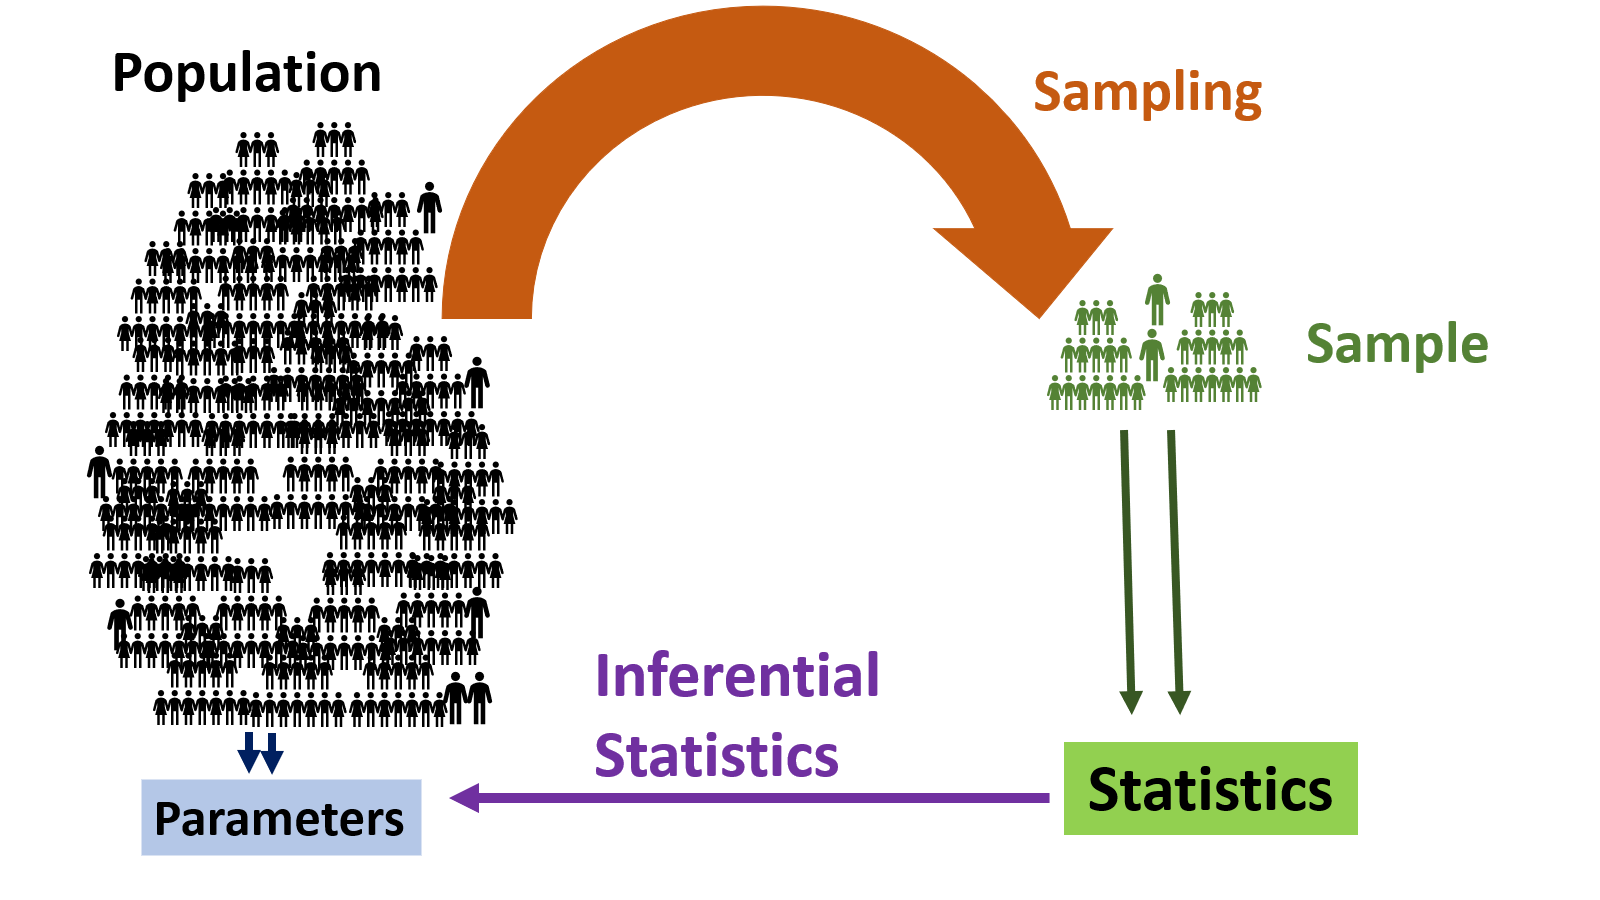
Two Branches of Statistics
1. Descriptive Statistics
Describe and summarize the collected data through numerical summaries, tables, and graphs.
2. Inferential Statistics
Statistical inference refers to the methods used to make estimations, decisions, or predictions about a population parameters based on the statistics computed from a sample that was selected from that population.
Census
A census involves collecting information from every individual or unit within the entire population of interest.
Sample Survey
A survey involves collecting information from a subset (sample) of the population to estimate characteristics of the entire population.
Notations
Parameters are usually denoted by Greek letters
Example:
\mu - \text{population mean}
\sigma - \text{population variance}
Statistics are denoted by English letters (Capital or Simple? You will learn more of this in the “Statistical Inference” section)
Eample:
\bar{X} - \text{sample mean}
S^2 - \text{sample variance}