worldbankdata |>
  dplyr::select(c("Year", "Income")) |>
  dplyr::filter(Year == 2021) |>
  ggplot(aes(x = Income)) +
  geom_bar()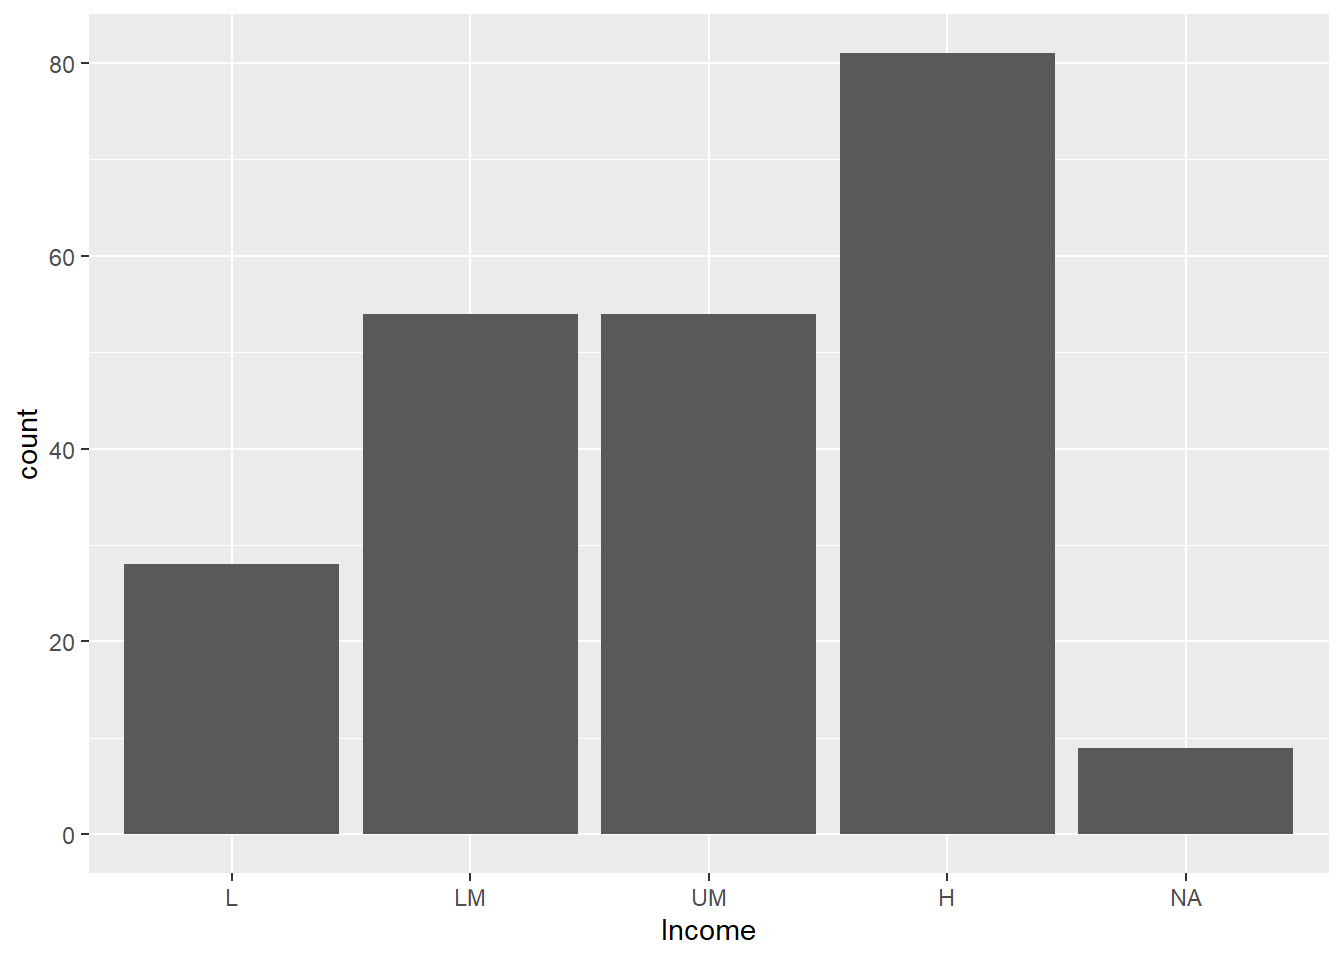
Package
ggplot2 (Wickham 2016)
Description
Draw a bar proportional to the specified number. For example, number of cases or user defined number.
Understandable aesthetics
required aesthetics
x, y,
optional aesthetics
alpha, colour, fill, group, linetype, linewidth
See also
Example
Example 1: Given observations
worldbankdata |>
dplyr::select(c("Year", "Income")) |>
dplyr::filter(Year == 2021) |>
ggplot(aes(x = Income)) +
geom_bar()
Example 2
worldbankdata |>
  dplyr::select(c("Year", "Income", "Region")) |>
  dplyr::filter(Year == 2021) |>
  ggplot(aes(x = Income, fill = Region)) +
  geom_bar() +
  scale_fill_brewer(palette = "Paired", na.value = "grey50")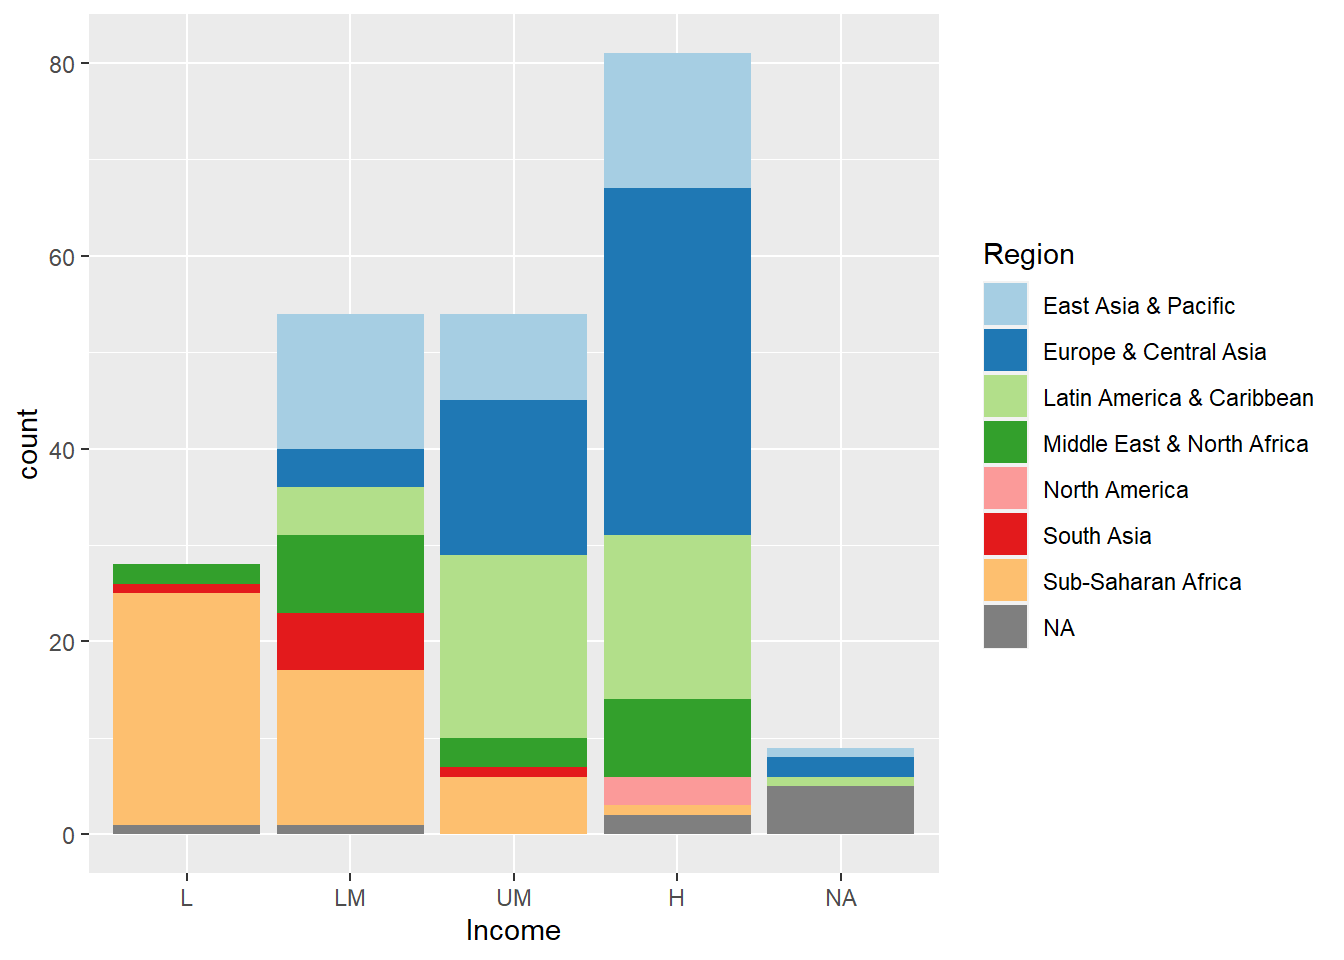
Example 3
worldbankdata |>
  dplyr::select(c("Year", "Income", "Region")) |>
  dplyr::filter(Year == 2021) |>
  ggplot(aes(x = Income, fill = Region)) +
  geom_bar(position = "dodge") +
  scale_fill_brewer(palette = "Paired", na.value = "grey50")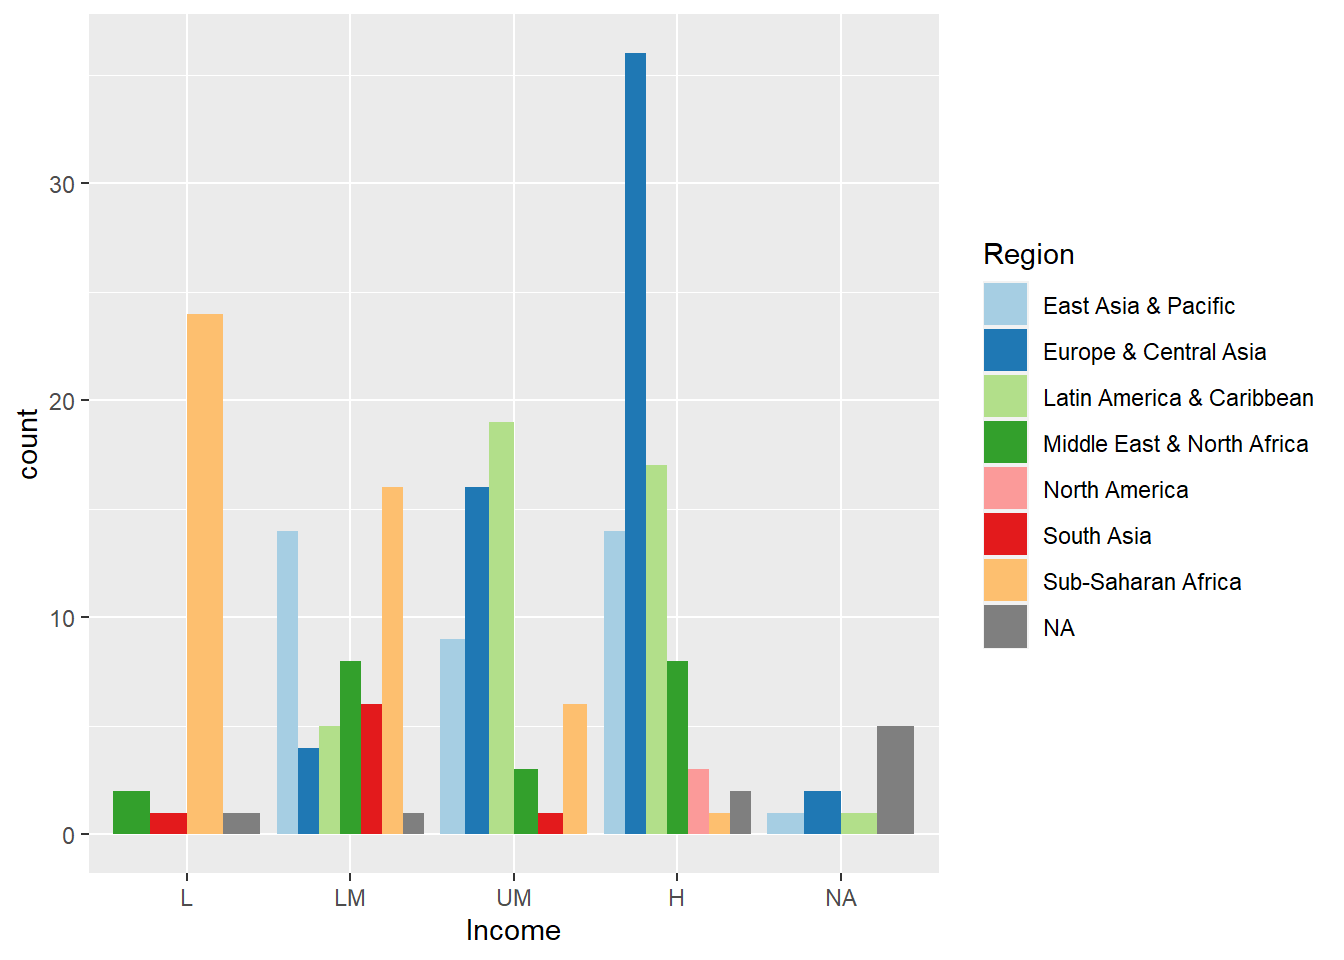
Example 4: Given counts
dfbar <- data.frame(class = c("A", "B"), income = c(100, 200))
ggplot(dfbar, aes(class, income)) +
  geom_bar(stat = "identity")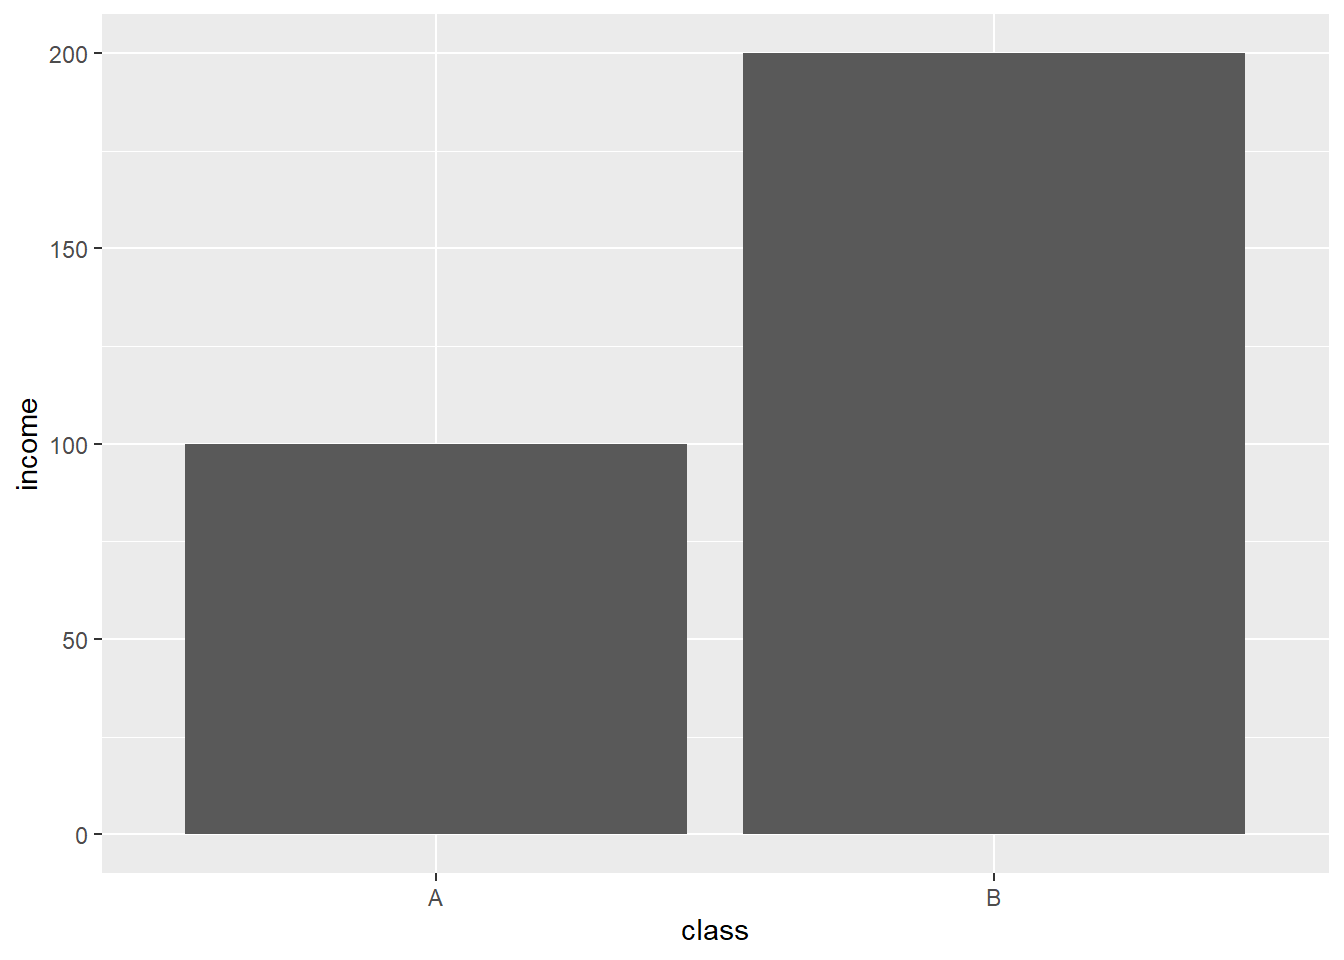
Package
ggpattern (FC, Davis, and ggplot2 authors 2023)
Description
Fill bars with patterns
Understandable aesthetics
required aesthetics
x, y,
optional aesthetics
pattern, pattern_angle
See also
Example
library(ggpattern)
worldbankdata |>
  tidyr::drop_na() |> ## Missing values should be removed to see the different patterns for different levels
  dplyr::select(c("Year", "Income")) |>
  dplyr::filter(Year == 2021) |>
  ggplot(aes(x = Income)) +
  geom_bar_pattern(aes(pattern = Income, pattern_angle = Income), fill = "white", colour = "black", pattern_spacing = 0.03, pattern_key_scale_factor = 1)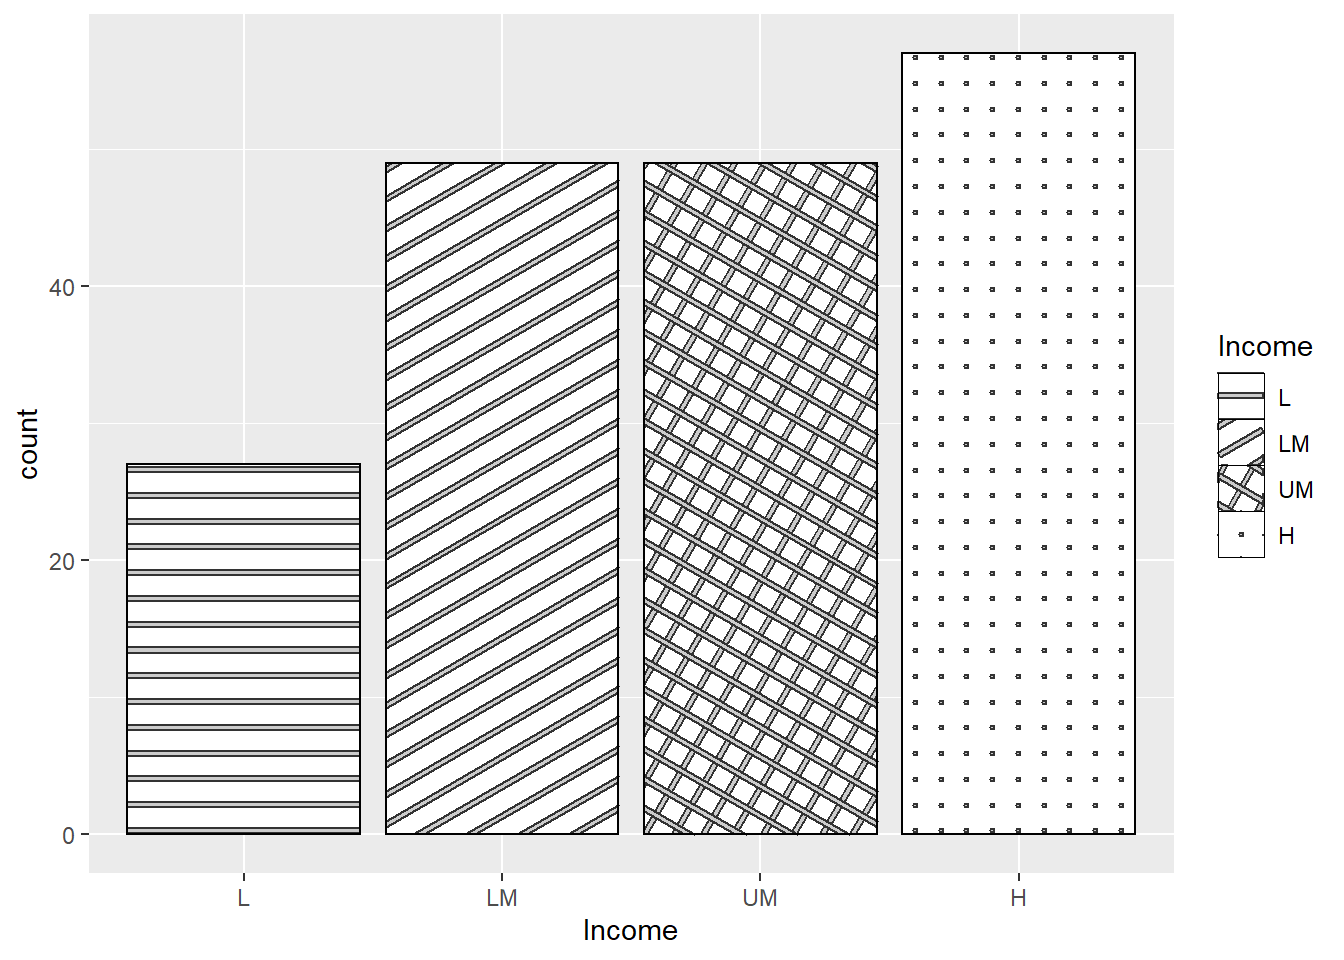
Package
ggplot2 (Wickham 2016)
Description
Divides the Cartesian plane created by x-variable and y-variable into rectangles (2D histogram), counts the number of observations in each rectangle. Only the observations with rectangles are filled according to the number of observations.
Understandable aesthetics
required aesthetics
x, y,
optional aesthetics
fill, group
See also
Example
ggplot(worldbankdata, aes(y = Cooking, x = Electricity)) +
  geom_bin_2d() +
  scale_fill_viridis(na.value = "grey50", limits = c(0, 30)) +
  theme(aspect.ratio = 1)
ggplot(worldbankdata, aes(y = Cooking, x = Electricity)) +
  geom_bin_2d(bins = 20) +
  scale_fill_viridis(na.value = "grey50", limits = c(0, 30)) +
  theme(aspect.ratio = 1)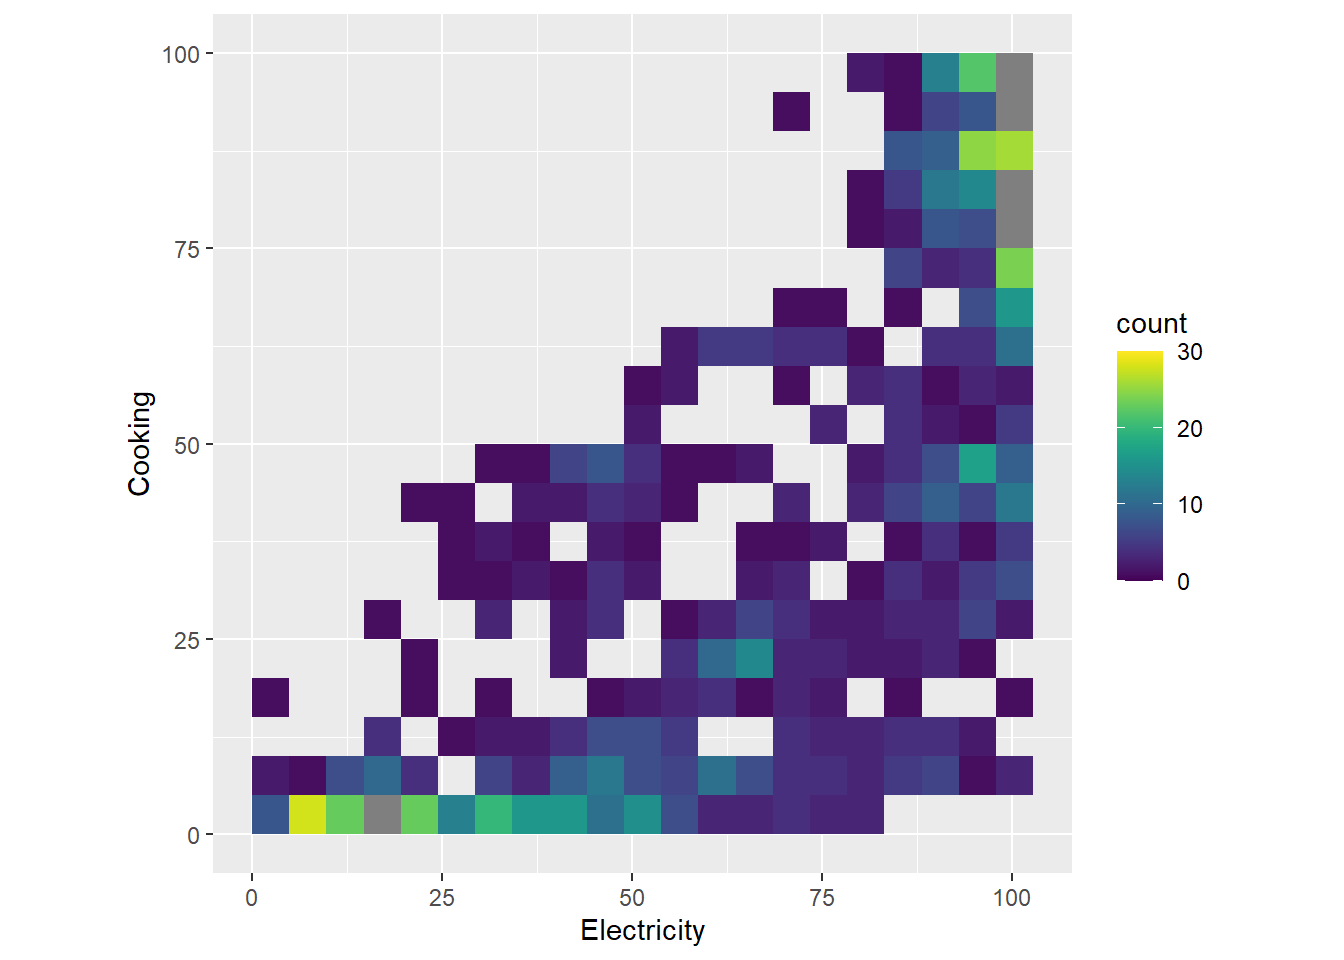
Package
ggpattern(FC, Davis, and ggplot2 authors 2023)
Description
Divides the Cartesian plane created by x-variable and y-variable into rectangles (2D-Histogram), counts the number of observations in each rectangle. Only the observations with rectangles are filled with a pattern.
Understandable aesthetics
Required aesthetics
x, y
Optional aesthetics
pattern_fill (pattern_* - for mapping variables under aesthetics), pattern (to set a patten, for example pattern=‘stripe’), fill, colour
See also
Example
worldbankdata |>
  drop_na() |>
  ggplot(aes(y = Cooking, x = Electricity)) +
  geom_bin2d_pattern(aes(pattern_spacing = ..density..), fill = "white", colour = "black", bins = 20) +
  theme(aspect.ratio = 1)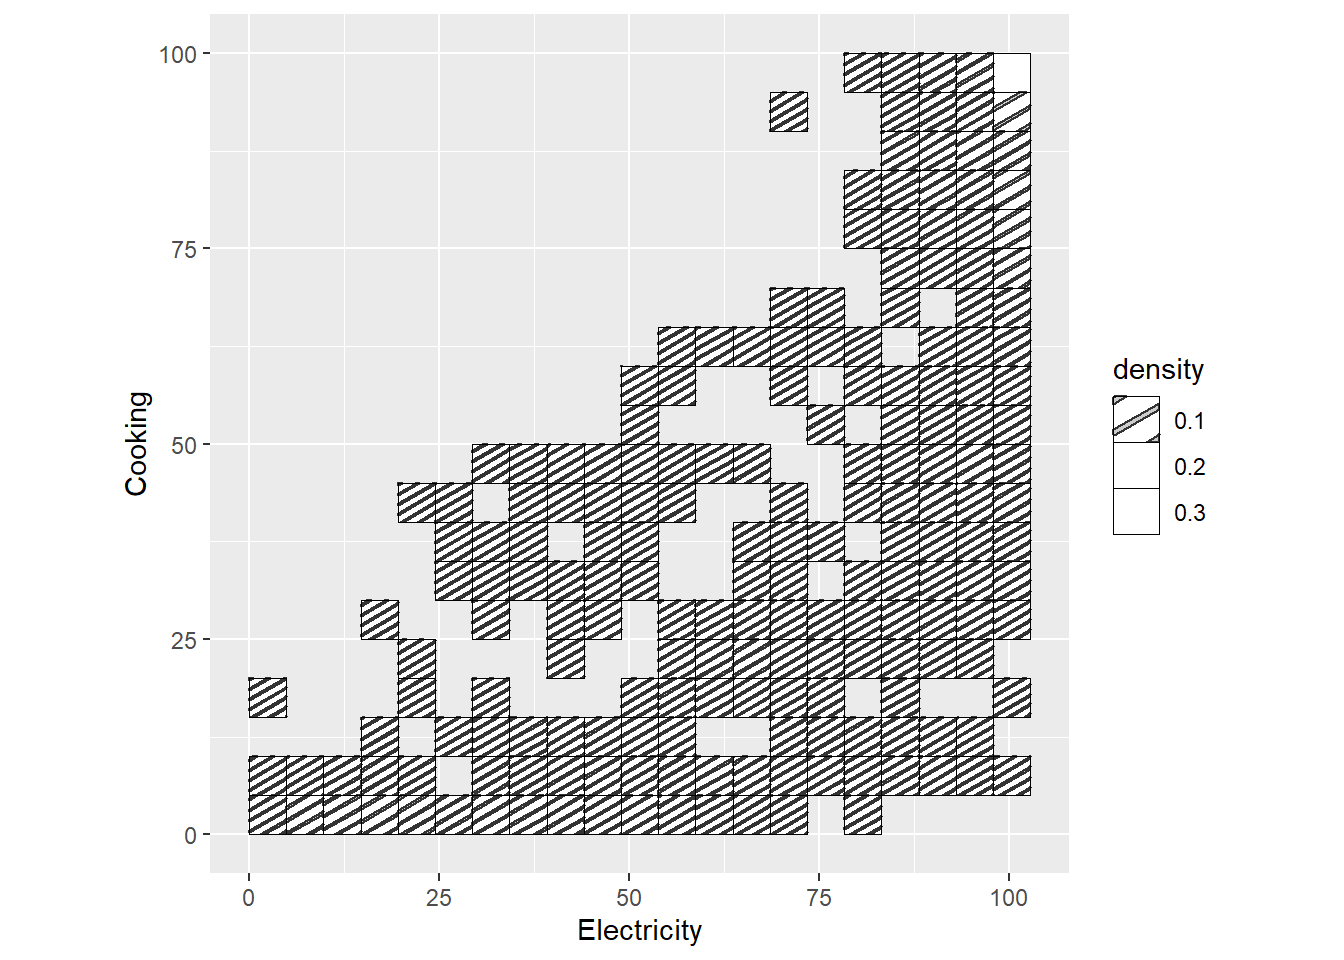
Package
ggplot2 (R-ggplot2?)
Description
Divides the Cartesian plane created by x-variable and y-variable into rectangles, counts the number of observations in each rectangle. Only the observations with rectangles are filled according to the number of observations.
Understandable aesthetics
x, y, fill, group
See also
Example
ggplot(worldbankdata, aes(y = Cooking, x = Electricity)) +
  geom_bin2d() +
  theme(aspect.ratio = 1) +
  scale_fill_viridis(na.value = "grey50", limits = c(0, 30))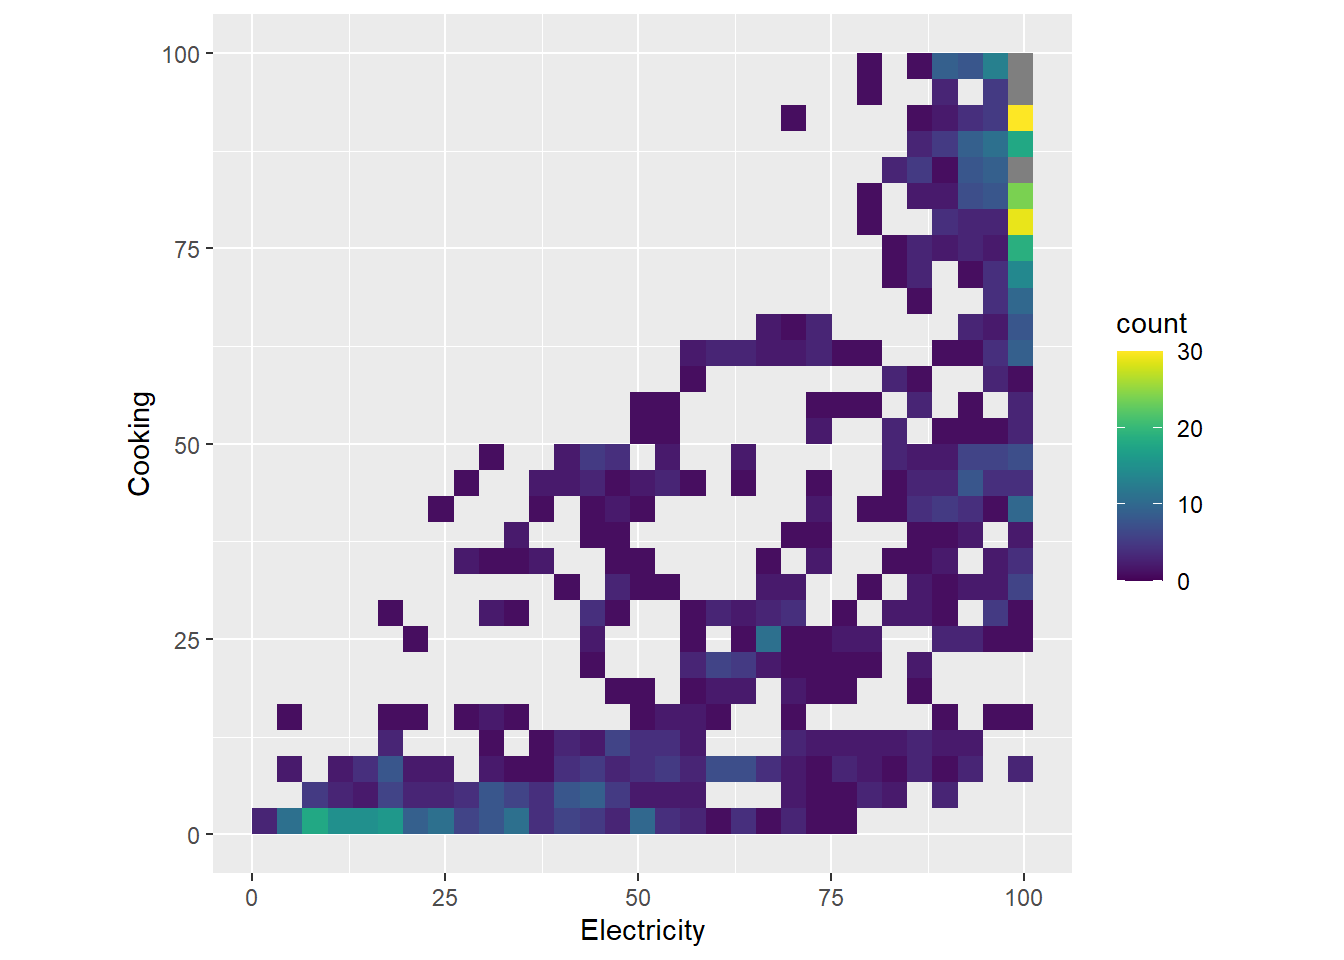
Package
ggplot2 (R-ggplot2?)
Description
Draws nothing.
Package
ggplot2 (R-ggplot2?)
Description
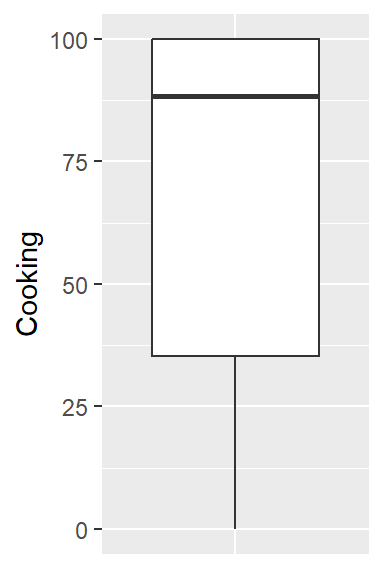
Draw a bar proportional to the specified number. For example, number of cases or user defined number.
See also
Example
worldbankdata |>
  dplyr::filter(Year == 2021) |>
  dplyr::select(Cooking) |>
  ggplot(aes(y = Cooking, x = factor(0))) +
  geom_boxplot() +
  theme(
    axis.title.x = element_blank(),
    axis.text.x = element_blank(),
    axis.ticks.x = element_blank()
  )
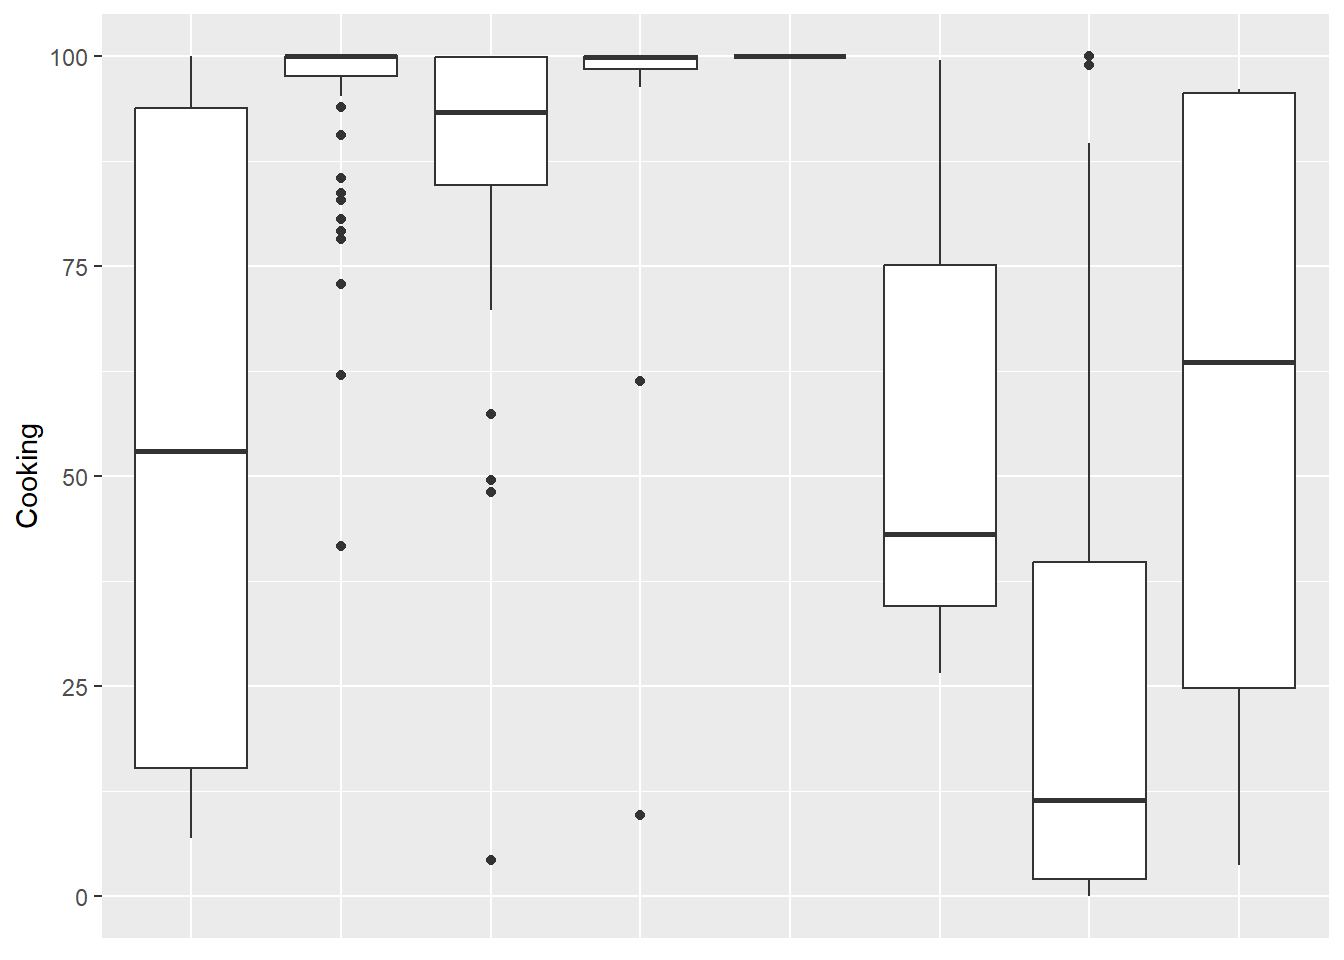
worldbankdata |>
  dplyr::filter(Year == 2021) |>
  ggplot(aes(y = Cooking, x = Region)) +
  geom_boxplot() +
  theme(
    axis.title.x = element_blank(),
    axis.text.x = element_blank(),
    axis.ticks.x = element_blank()
  )
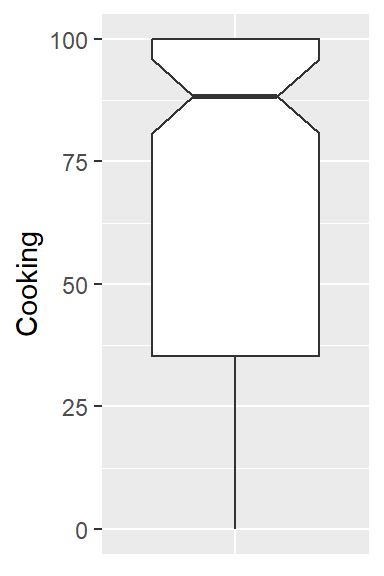
worldbankdata |>
  dplyr::filter(Year == 2021) |>
  ggplot(aes(y = Cooking, x = factor(0))) +
  geom_boxplot(
    outlier.colour = "black", outlier.shape = 16,
    outlier.size = 2, notch = TRUE
  ) +
  theme(
    axis.title.x = element_blank(),
    axis.text.x = element_blank(),
    axis.ticks.x = element_blank()
  )
Package
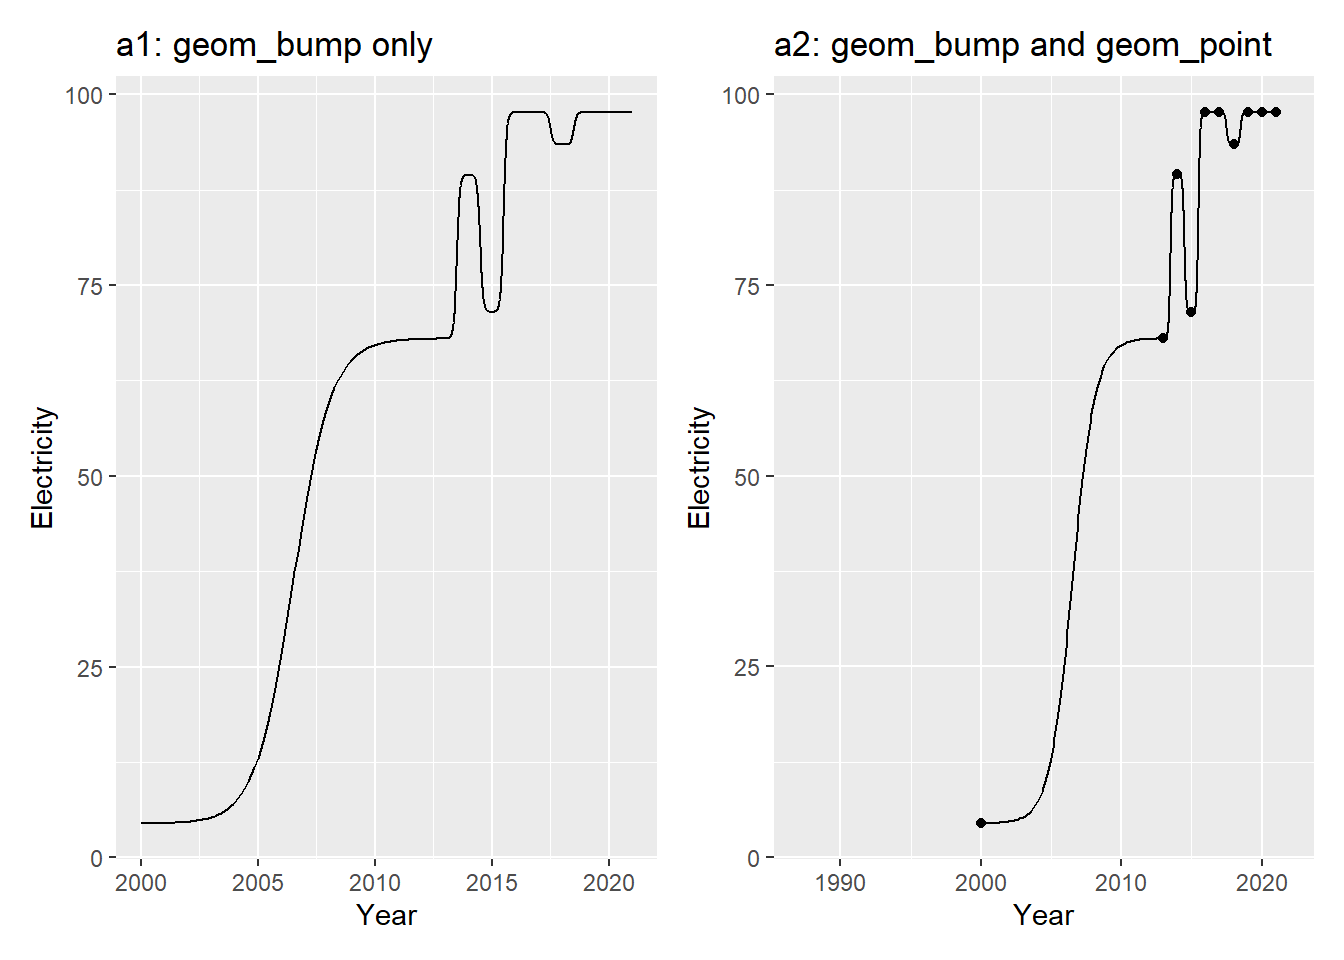
ggbump (Sjoberg 2020)
Description
Creates a smooth rank over time.
Understandable aesthetics
required aesthetics
x, y
optional aesthetics
colour, alpha, size
See also
Example
library(ggbump)
a1 <- worldbankdata |>
  filter(Country == "Afghanistan") |>
  ggplot(aes(x = Year, y = Electricity)) +
  geom_bump() +
  ggtitle("a1: geom_bump only")
a2 <- worldbankdata |>
  filter(Country == "Afghanistan") |>
  ggplot(aes(x = Year, y = Electricity)) +
  geom_bump() +
  geom_point() +
  ggtitle("a2: geom_bump and geom_point")
a1 | a2