library(ggforce)
worldbankdata |>
  filter(Country == "Angola") |>
  ggplot(aes(x = Cooking, y=Electricity)) +
  geom_mark_circle(aes(fill = Income, label = Income),
                   con.cap = 0) +
  geom_point(aes(col=Income))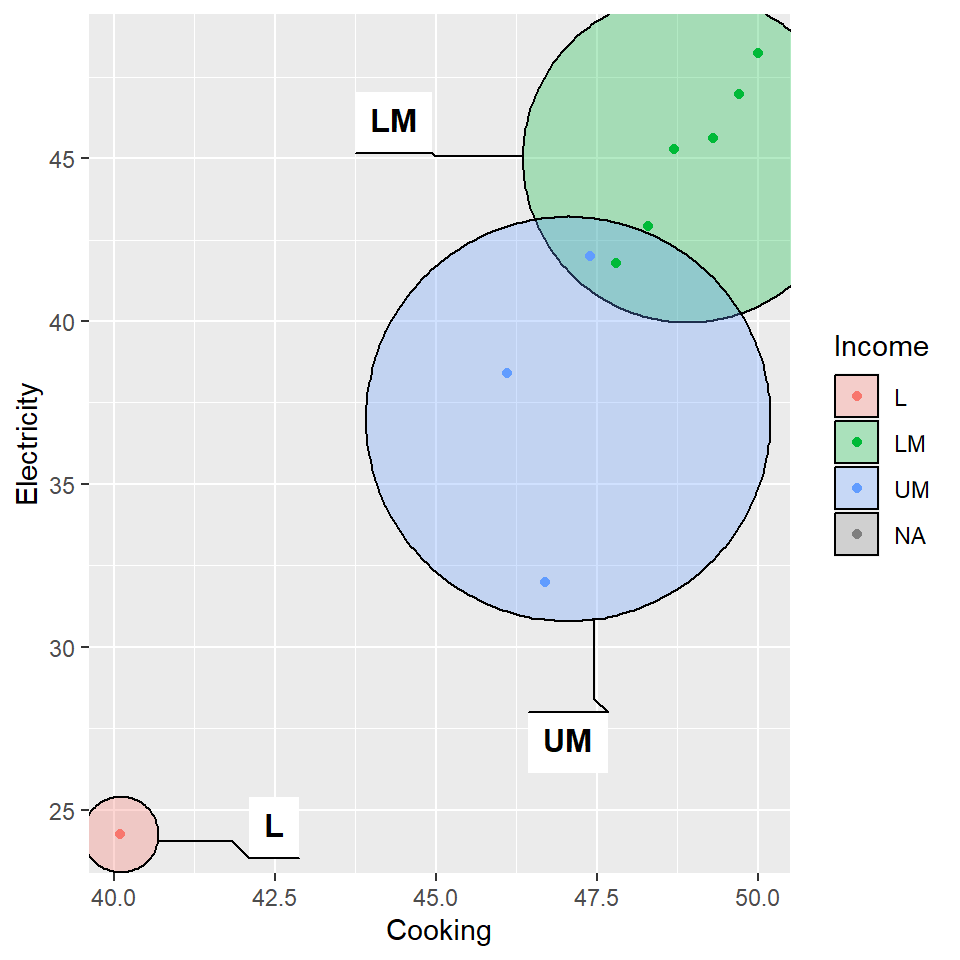
Package
ggforce (Pedersen 2022)
Description
Annotate sets of points via circles.
Understandable aesthetics
required aesthetics
x
y
optional aesthetics
x0 (used to anchor the label), y0 (used to anchor the label), filter, label, description, color, fill, group, size, linetype, alpha
See also
geom_circle, geom_encircle, geom_mark_ellipse, geom_mark_hull, geom_mark_rect
Example
library(ggforce)
worldbankdata |>
filter(Country == "Angola") |>
ggplot(aes(x = Cooking, y=Electricity)) +
geom_mark_circle(aes(fill = Income, label = Income),
con.cap = 0) +
geom_point(aes(col=Income))
Package
ggforce (Pedersen 2022)
Description
Annotate sets of points via ellipse.
Understandable aesthetics
required aesthetics
x
y
optional aesthetics
x0 (used to anchor the label), y0 (used to anchor the label), filter, label, description, color, fill, group, size, linetype, alpha
See also
geom_circle, geom_encircle, geom_mark_circle, geom_mark_hull, geom_mark_rect
Example
library(ggforce)
worldbankdata |>
  filter(Country == "Angola") |>
  ggplot(aes(x = Cooking, y=Electricity)) +
  geom_mark_ellipse(aes(fill = Income, label = Income),
                   con.cap = 0) +
  geom_point(aes(col=Income))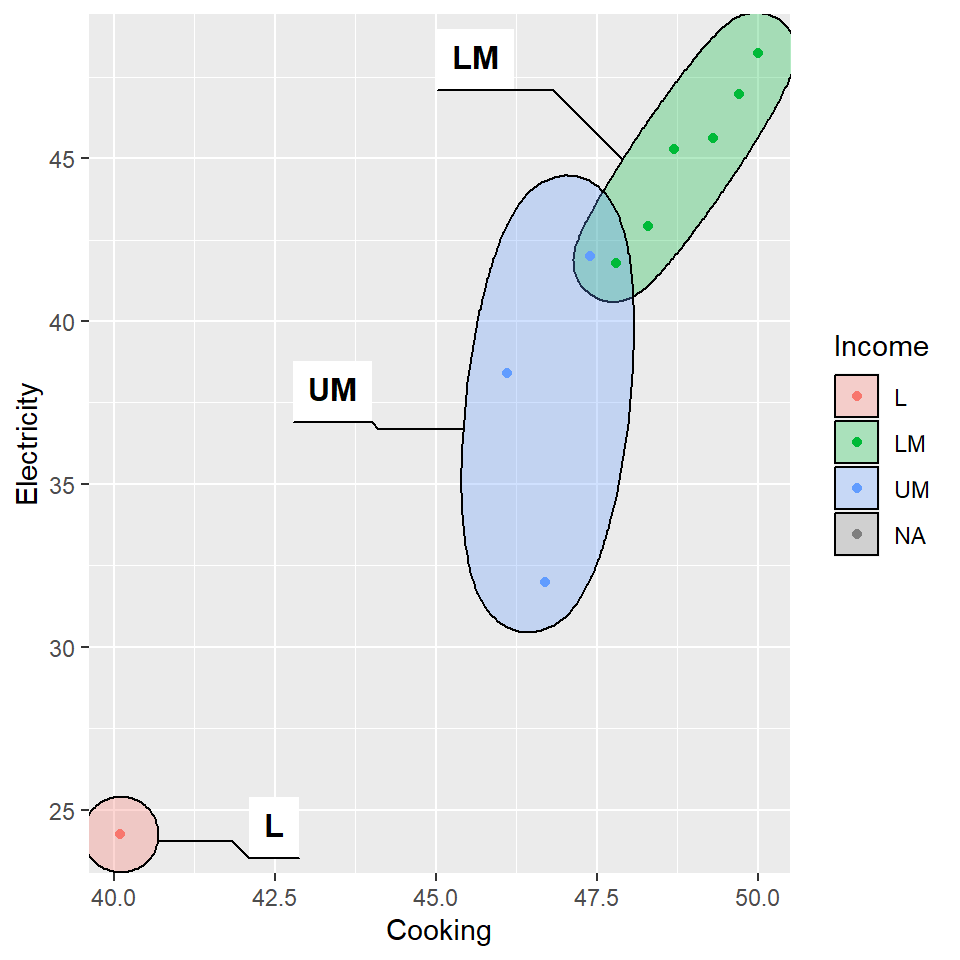
Package
ggforce (Pedersen 2022)
Description
Annotate sets of points via hulls.
Understandable aesthetics
required aesthetics
x
y
optional aesthetics
x0 (used to anchor the label), y0 (used to anchor the label), filter, label, description, color, fill, group, size, linetype, alpha
See also
geom_circle, geom_encircle, geom_mark_circle, geom_mark_ellipse, geom_mark_rect
Example
library(ggforce)
library(concaveman)
worldbankdata |>
  filter(Income == "L" | Income =="UM") |>
  filter(Year == 2021) |>
  ggplot(aes(x = Cooking, y=Electricity)) +
  geom_mark_hull(aes(fill=Income, lable = Income)) +
  geom_point(aes(col=Income))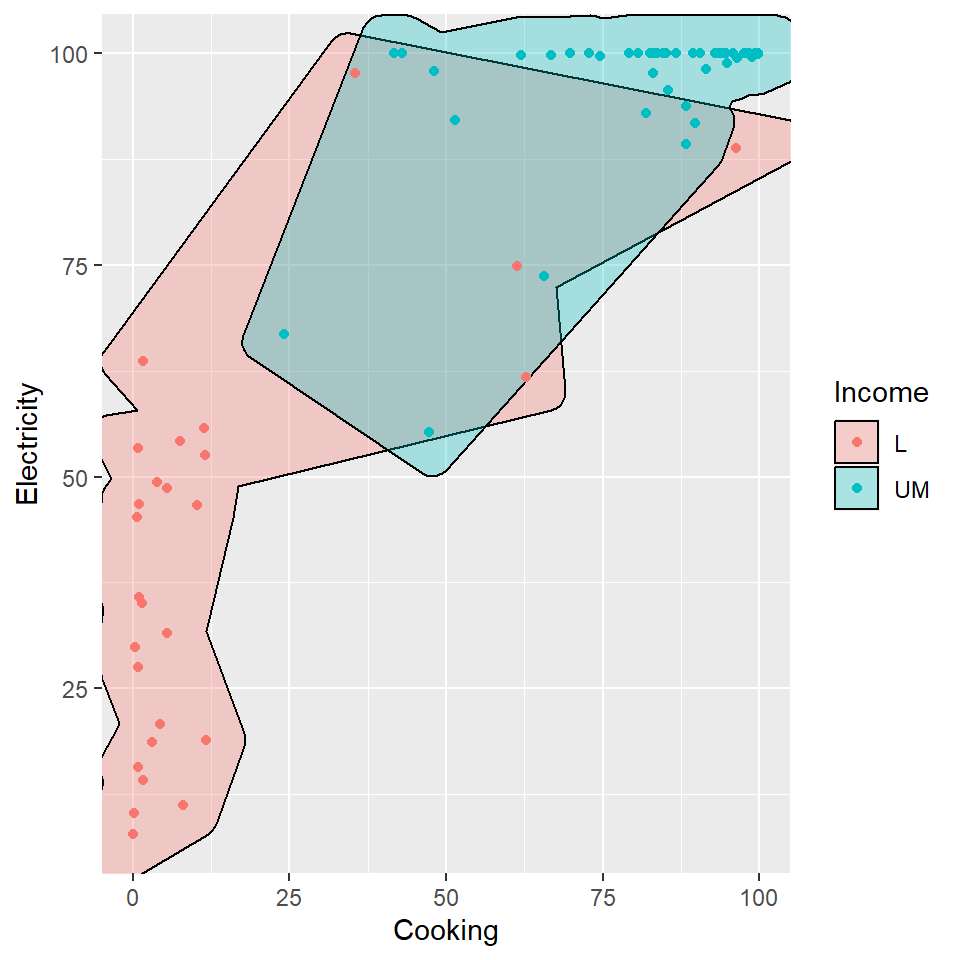
Package
ggforce (Pedersen 2022)
Description
Annotate sets of points via rectangles.
Understandable aesthetics
required aesthetics
x
y
optional aesthetics
x0 (used to anchor the label), y0 (used to anchor the label), filter, label, description, color, fill, group, size, linetype, alpha
See also
geom_circle, geom_encircle, geom_mark_circle, geom_mark_ellipse, geom_mark_hull
Example
library(ggforce)
worldbankdata |>
  filter(Country == "Angola") |>
  ggplot(aes(x = Cooking, y=Electricity)) +
  geom_mark_rect(aes(fill = Income, label = Income),
                   con.cap = 0) +
  geom_point(aes(col=Income))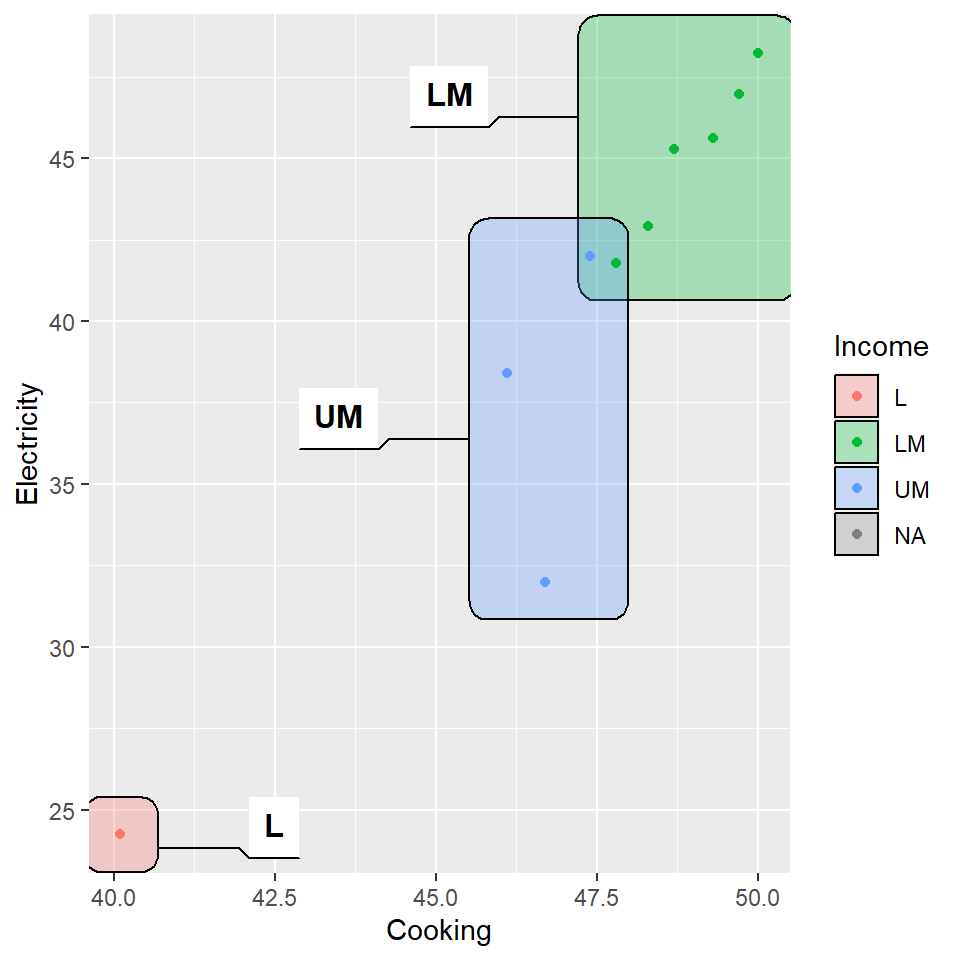
Package
ggplot2 (Wickham 2016)
Description
Display polygons as a map.
Understandable aesthetics
required aesthetics
map_id
**optional aesthetics*
alpha, colour, fill ,group, linetype, linewidth, subgropu
See also
Example
world = map_data("world")
ggplot() +
  geom_map(
    data = world, map = world,
    aes(long, lat, map_id = region),
fill = "white", colour = "#7f7f7f", size=0.5) 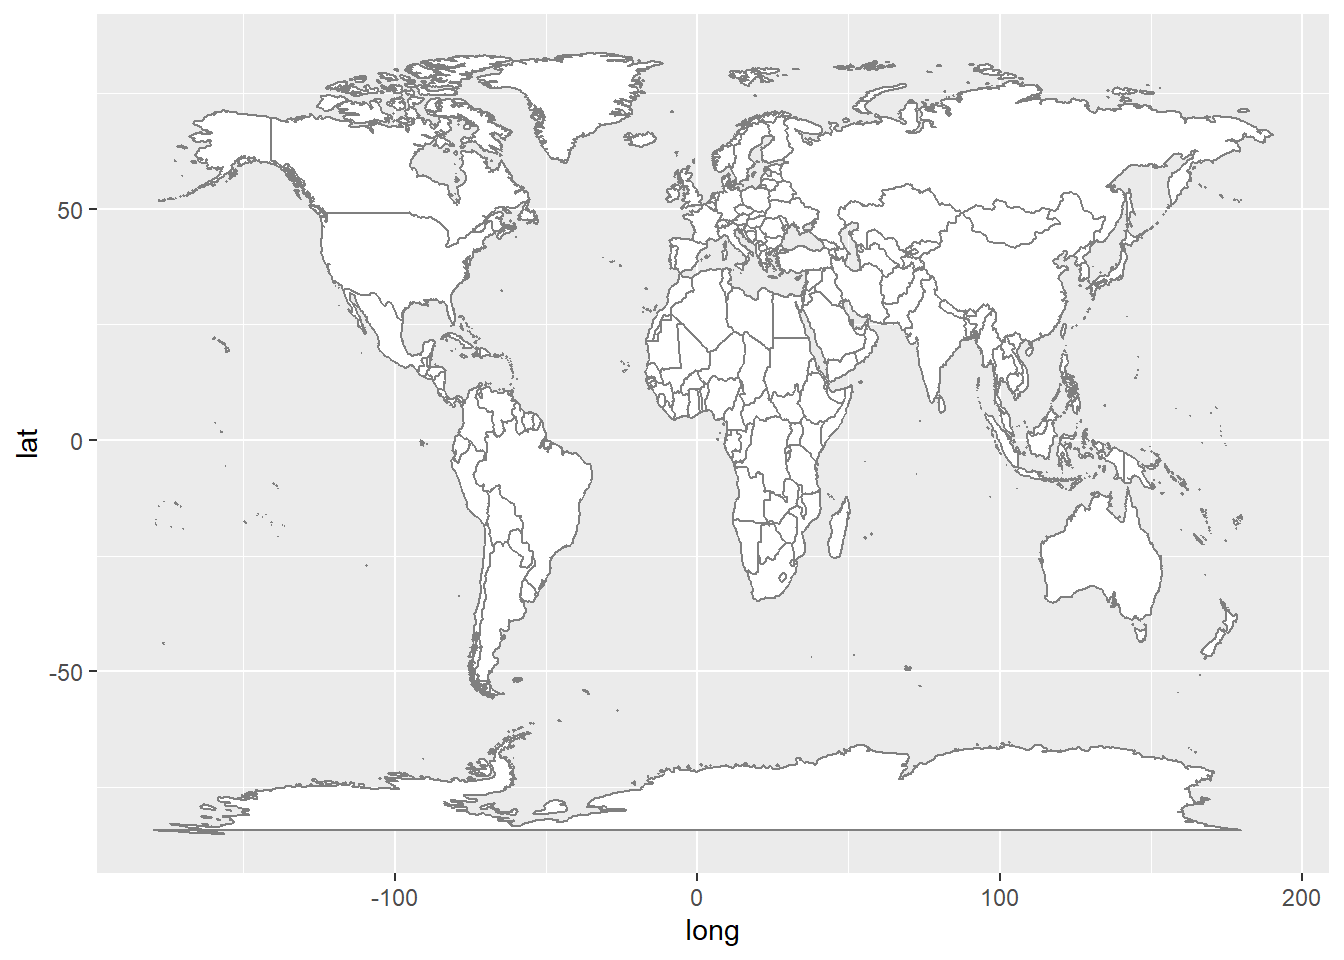
Package
ggmosaic (Jeppson, Hofmann, and Cook 2021)
Description
Create mosaic plot
Understandable aesthetics
x, y, xmin, xmax, ymin, ymax
See also
geom_bar, geom_mosaic_jitter, geom_mosaic_text
Example
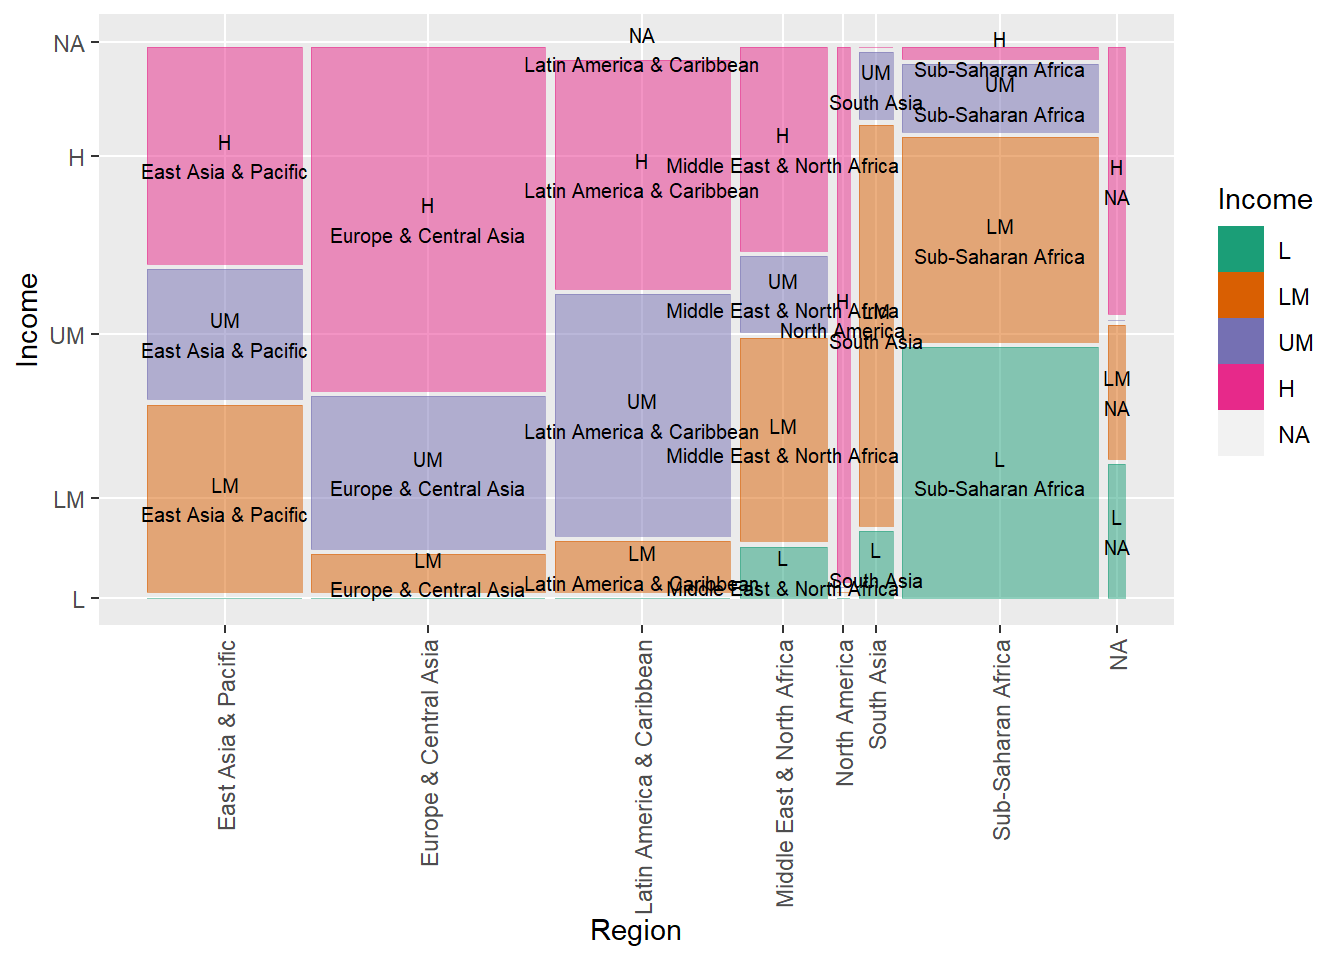
library(ggmosaic)
worldbankdata |>
  filter(Year == 2022) |>
  ggplot() +
  geom_mosaic(aes(x = product(Region), fill = Income)) +
  scale_fill_brewer(palette = "Dark2") +
theme(axis.text.x = element_text(angle = 90, vjust = 0.5, hjust=1)) 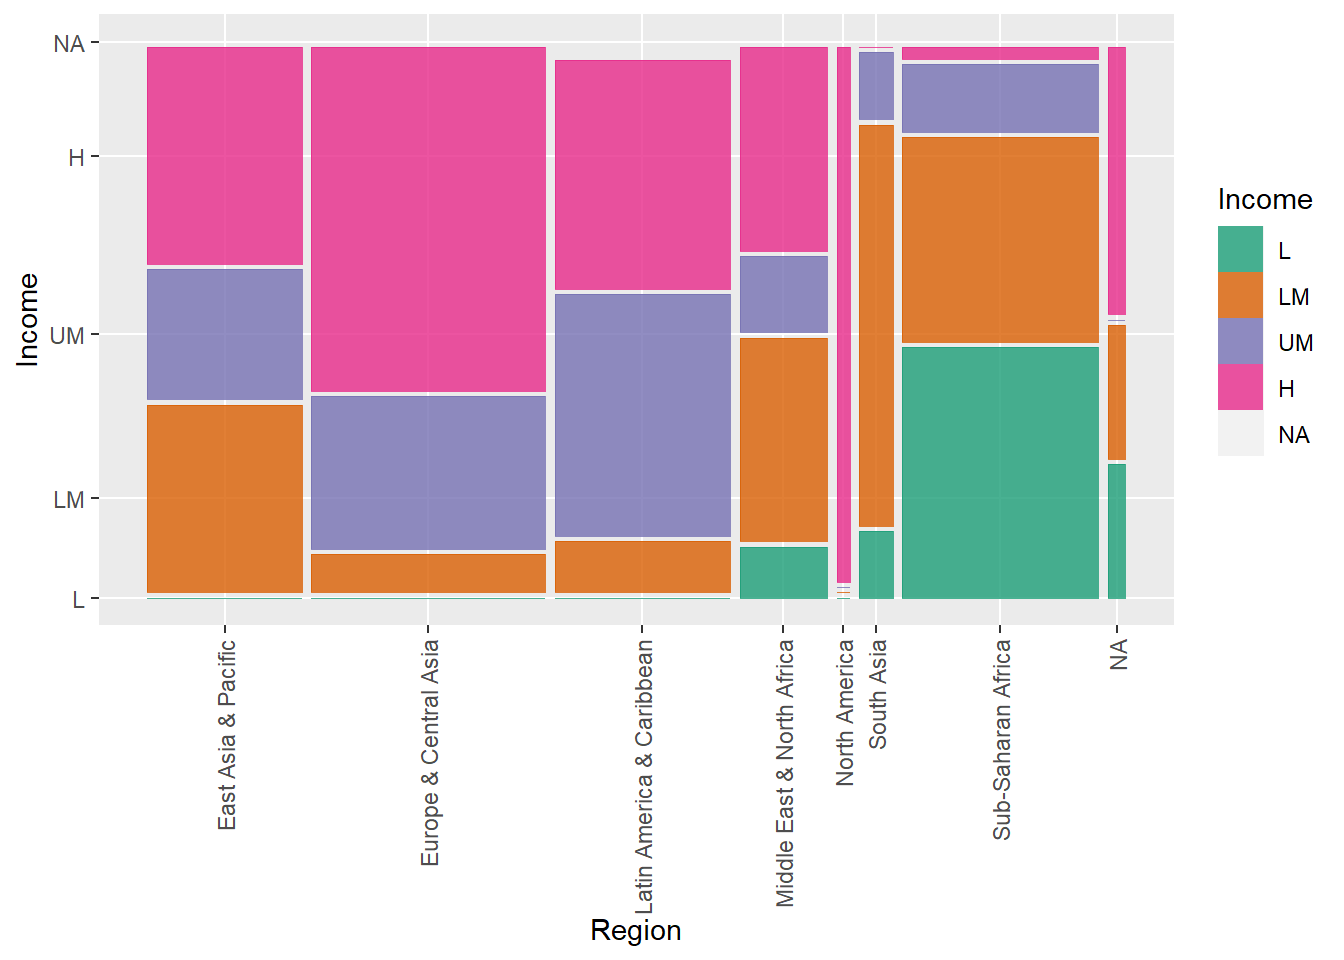
Package
ggmosaic (Jeppson, Hofmann, and Cook 2021)
Description
Create a mosaic plot with text or labels.
x, y, xmin, xmax, ymin, ymax
See also
geom_bar, geom_mosaic, geom_mosaic_text
Example
library(ggmosaic)
worldbankdata |>
  filter(Year == 2022) |>
  ggplot() +
  geom_mosaic(aes(x = product(Region), fill = Income), alpha=0.5) +
  geom_mosaic_text(aes(x = product(Region), fill = Income)) +
  scale_fill_brewer(palette = "Dark2") +
  theme(axis.text.x = element_text(angle = 90, vjust = 0.5, hjust=1))