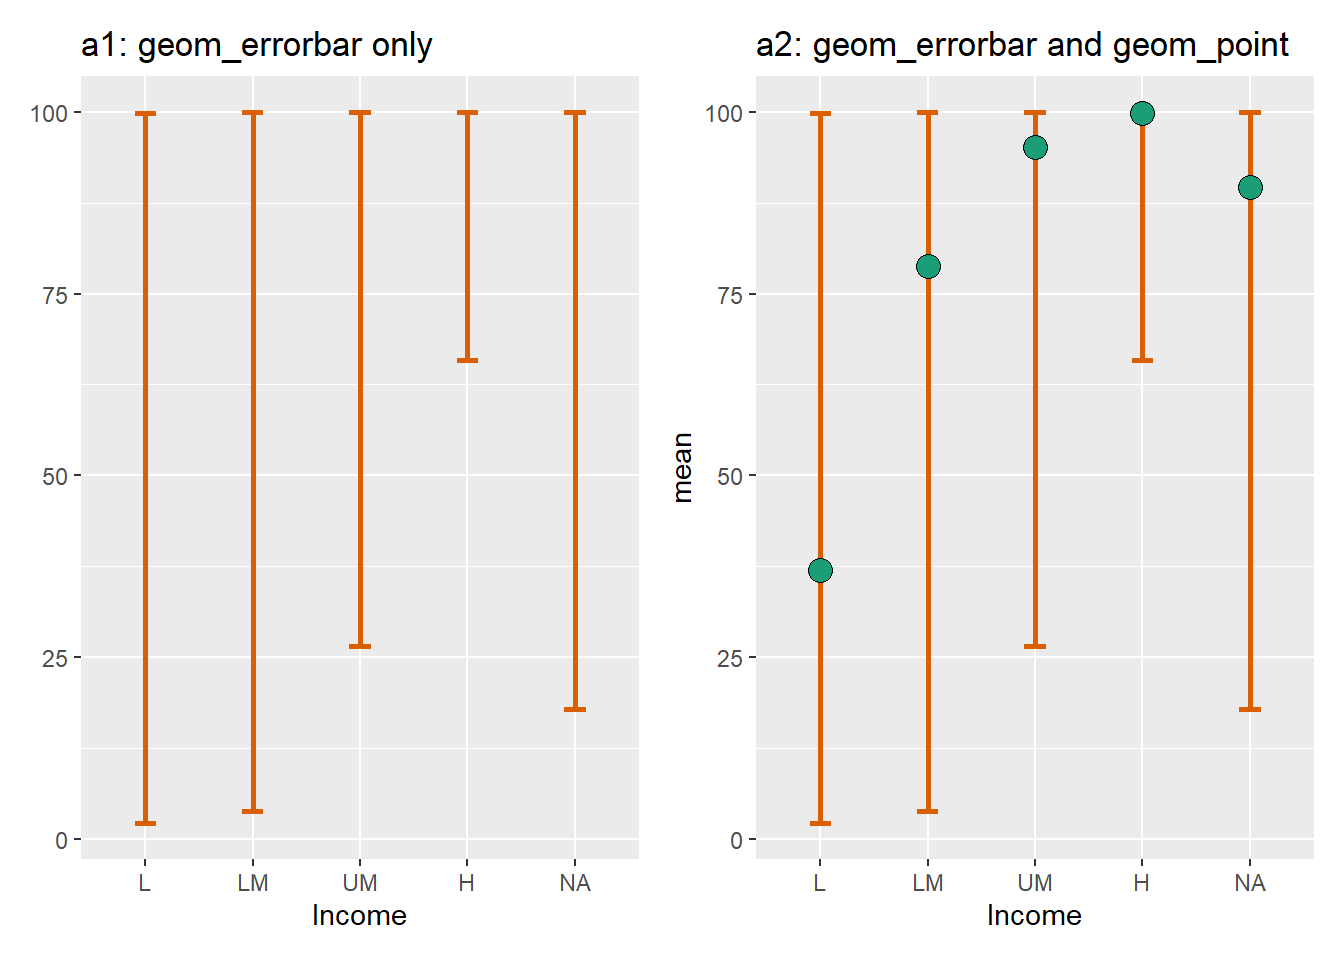
7  geom_e

7.1 geom_errorbar

7.1.1 Package

ggplot2 (Wickham 2016)

7.1.2 Description

Draws a vertical interval defined by x, ymin and ymax.

7.1.3 Understandable aesthetics

required aesthetics

x or y

ymin or xmin (y/x coordinate of the lower whisker)

ymax or xmax (y/x coordinate of the upper whisker)

optional aesthetics

alpha, colour, group, linetype, linewidth

7.1.4 The statistical transformation to use on the data for this layer

stat_identity

7.1.5 See also

geom_crossbar, geom_dumbbell

7.1.6 Example

df <- worldbankdata |>
  group_by(Income) |>
  summarise(min = min(Electricity, na.rm=TRUE), max = max(Electricity, na.rm=TRUE), mean = mean(Electricity, na.rm=TRUE))
df
# A tibble: 5 × 4
  Income   min   max  mean
  <fct>  <dbl> <dbl> <dbl>
1 L       2.11  99.8  37.0
2 LM      3.81 100    78.8
3 UM     26.5  100    95.1
4 H      65.9  100    99.9
5 <NA>   17.8  100    89.7
a1 <- ggplot(data=df, aes(x=Income, ymin=min, ymax=max)) + 
geom_errorbar(width=0.2, size=1, color="#d95f02") + 
  labs(title = "a1: geom_errorbar only")

a2 <- ggplot(data=df, aes(x=Income, ymin=min, ymax=max)) + 
  geom_errorbar(width=0.2, size=1, color="#d95f02") + 
  geom_point(data=df, mapping=aes(x=Income, y=mean), size=4, shape=21, fill="#1b9e77") +
  labs(title = "a2: geom_errorbar and geom_point")
a1|a2

7.2 geom_errorbarh

7.2.1 Package

ggplot2 (Wickham 2016)

7.2.2 Description

Draws horizontal error bars, defined by an upper and lower value.

7.2.3 Understandable aesthetics

required aesthetics

x or y

ymin or xmin (y/x coordinate of the lower whisker)

ymax or xmax (y/x coordinate of the upper whisker)

optional aesthetics

alpha, colour, group, linetype, linewidth

7.2.4 The statistical transformation to use on the data for this layer

stat_identity

7.2.5 See also

geom_crossbar, geom_dumbbell

7.2.6 Example

df <- worldbankdata |>
  group_by(Income) |>
  summarise(min = min(Electricity, na.rm=TRUE), max = max(Electricity, na.rm=TRUE), mean = mean(Electricity, na.rm=TRUE))
df
# A tibble: 5 × 4
  Income   min   max  mean
  <fct>  <dbl> <dbl> <dbl>
1 L       2.11  99.8  37.0
2 LM      3.81 100    78.8
3 UM     26.5  100    95.1
4 H      65.9  100    99.9
5 <NA>   17.8  100    89.7
a1 <- ggplot(data=df, aes(y=Income, x=max, xmin=min, xmax=max)) + 
geom_errorbarh(width=0.2, size=1, color="#d95f02") + 
  labs(title = "a1: geom_errorbarh only")
a2 <- ggplot(data=df, aes(y=Income, x=max, xmin=min, xmax=max)) + 
  geom_errorbarh(width=0.2, size=1, color="#d95f02") + 
  geom_point(data=df, mapping=aes(y=Income, x=mean), size=4, shape=21, fill="#1b9e77") +
  labs(title = "a2: geom_errorbarh and geom_point")
a1|a2

7.3 geom_encircle

7.3.1 Package

ggalt (Rudis, Bolker, and Schulz 2017)

7.3.2 Description

Draws a polygon enclosing all the points.

7.3.3 Understandable aesthetics

required aesthetics

x or y

optional aesthetics

alpha, colour, group, linetype, linewidth, s_shape, expand

7.3.4 The statistical transformation to use on the data for this layer

stat_identity

7.3.5 See also

geom_circle

7.3.6 Example

library(ggalt)
a1 <- worldbankdata |>
  filter(Income == "L") |>
ggplot(aes(y = Cooking, x=Electricity)) + 
  geom_point() + 
  geom_encircle() + 
  theme(aspect.ratio = 1) + 
  labs(title = "a1: with default setting")
a2 <- worldbankdata |>
  filter(Income == "L") |>
ggplot(aes(y = Cooking, x=Electricity)) + 
  geom_point() + 
  geom_encircle(s_shape=0.2, expand=0.01,fill="Red",alpha=0.4) + 
  theme(aspect.ratio = 1) + labs(title = "a2: without default settings")
a1|a2

7.4 geom_emoji

7.4.1 Package

emoGG (Miller 2023)

Installation

install.packages("remotes")
remotes::install_github("dill/emoGG")

7.4.2 Description

Plot emojis on the plot instead of points

7.4.3 Understandable aesthetics

emoji

7.4.4 The statistical transformation to use on the data for this layer

stat_identity

7.4.5 See also

geom_point

7.4.6 Example

library(emoGG)
a1 <- worldbankdata |>
  filter(Income == "LM") |>
ggplot(aes(y=Cooking, x=Electricity)) +
  geom_emoji(emoji = "1f600") + 
   theme(aspect.ratio = 1) + labs("a1: using emoji")
a2 <- worldbankdata |>
  filter(Income == "LM") |>
ggplot(aes(y=Cooking, x=Electricity)) +
  geom_point() + 
   theme(aspect.ratio = 1) + labs("a2: using points")
a1|a2