geom_label
Package
ggplot2 (Wickham 2016)
Description
Labelling plots
Understandable aesthetics
Required aesthetics
x, y, label
Optional aesthetics
alpha, angle, colour, family, fontface, group, hjust, lineheight, size, vjust
See also
geom_text
Example
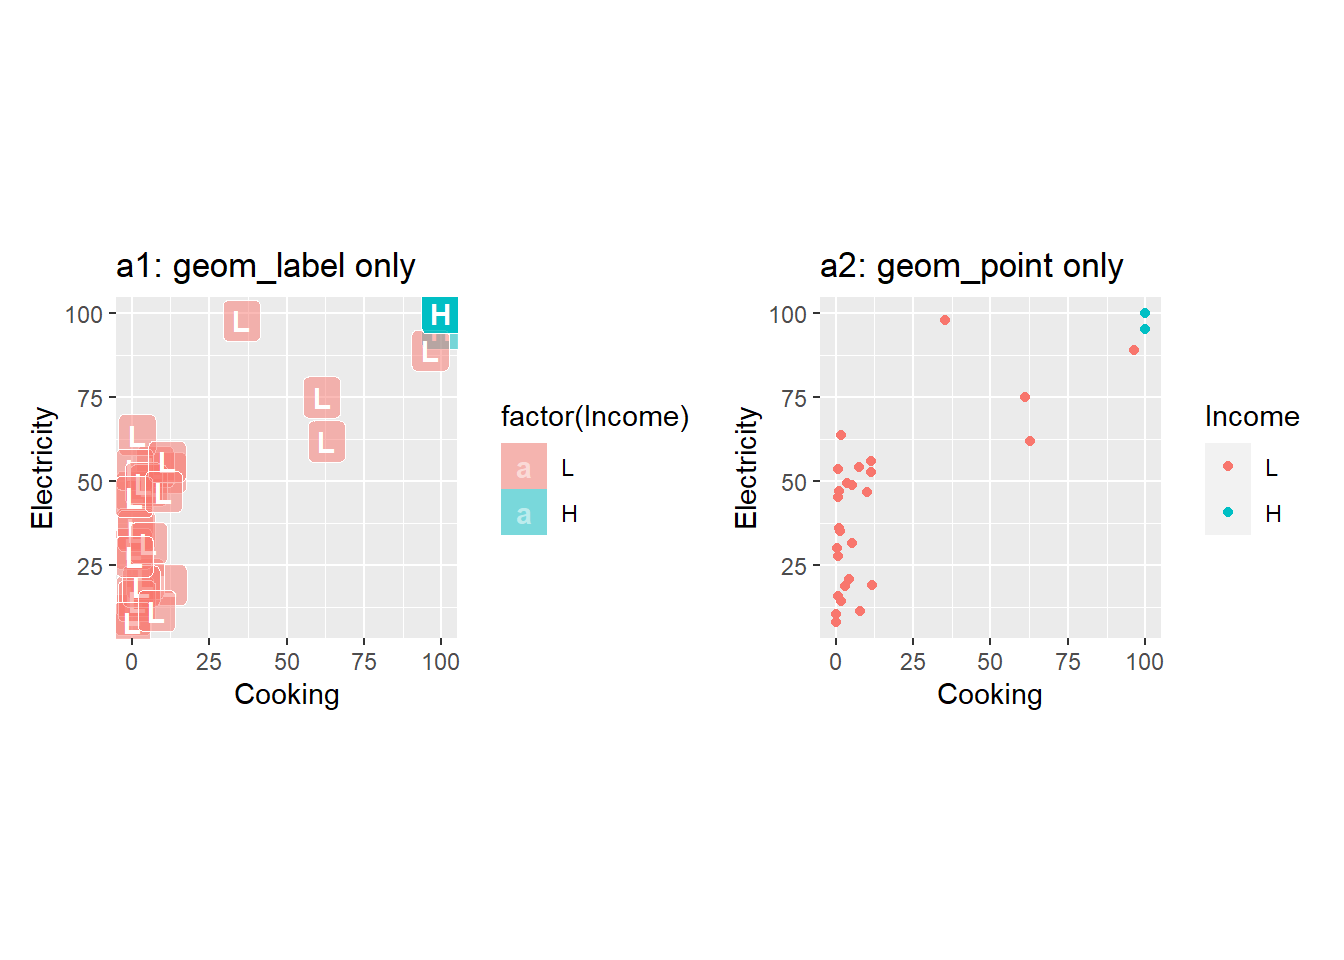
a1 <- worldbankdata |>
  filter(Income == "L" | Income =="H") |>
  filter(Year == 2021) |>
  ggplot(aes(x = Cooking, y = Electricity, label = Income)) +
  geom_label(aes(fill = factor(Income)), colour = "white", fontface = "bold", alpha=0.5) + theme(aspect.ratio = 1) + labs(title = "a1: geom_label only")
a2 <- worldbankdata |>
  filter(Income == "L" | Income =="H") |>
  filter(Year == 2021) |>
  ggplot(aes(x = Cooking, y = Electricity, label = Income)) +
  geom_point(aes(col = Income)) +  theme(aspect.ratio = 1) +
  labs(title = "a2: geom_point only")
a1|a2
geom_line
Package
ggplot2 (Wickham 2016)
Description
Connects data in order of the variable on the x axis.
Understandable aesthetics
required aesthetics
x
y
optional aesthetics
alpha, colour, group, linetype, linewidth
See also
geom_path
Example
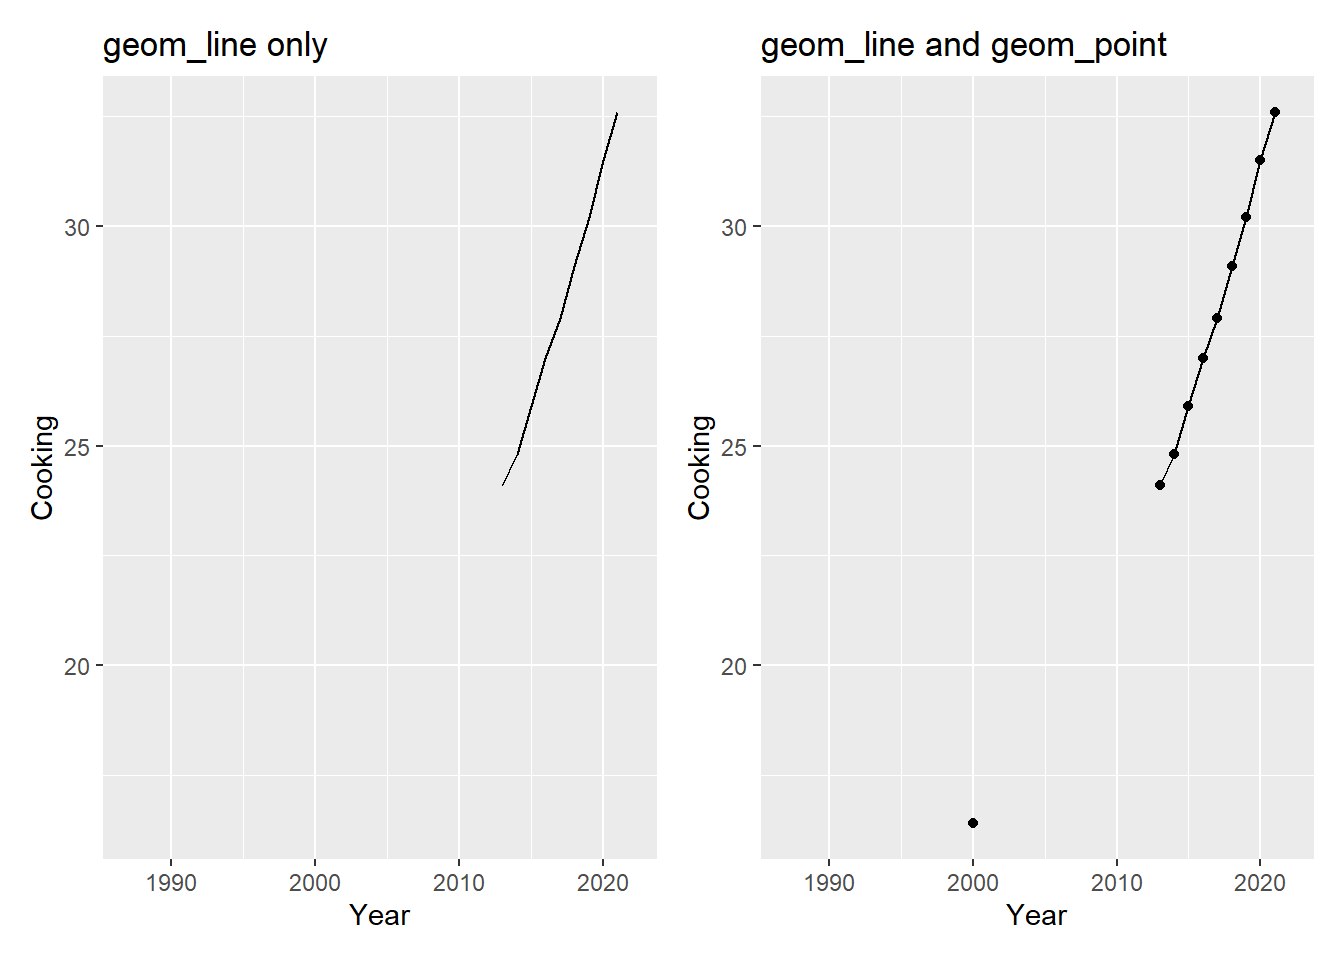
a1 <- worldbankdata |>
  filter(Country == "Sri Lanka") |>
  ggplot(aes(x=Year, y=Cooking)) +
  geom_line() + ggtitle("geom_line only")
a2 <- worldbankdata |>
  filter(Country == "Sri Lanka") |>
  ggplot(aes(x=Year, y=Cooking)) +
  geom_line() +
  geom_point() +
  ggtitle("geom_line and geom_point")
a1|a2
geom_linerange
Package
ggplot2 (Wickham 2016)
Description
Representing a vertical interval defined by x, ymin and ymax
Understandable aesthetics
required aesthetics
x or y,
ymin or xmin,
ymax or xmax
optional aesthetics
alpha, colour, group, linetype, linewidth
See also
geom_line, geom_crossbar, geom_errorbar, geom_pointrange
Example
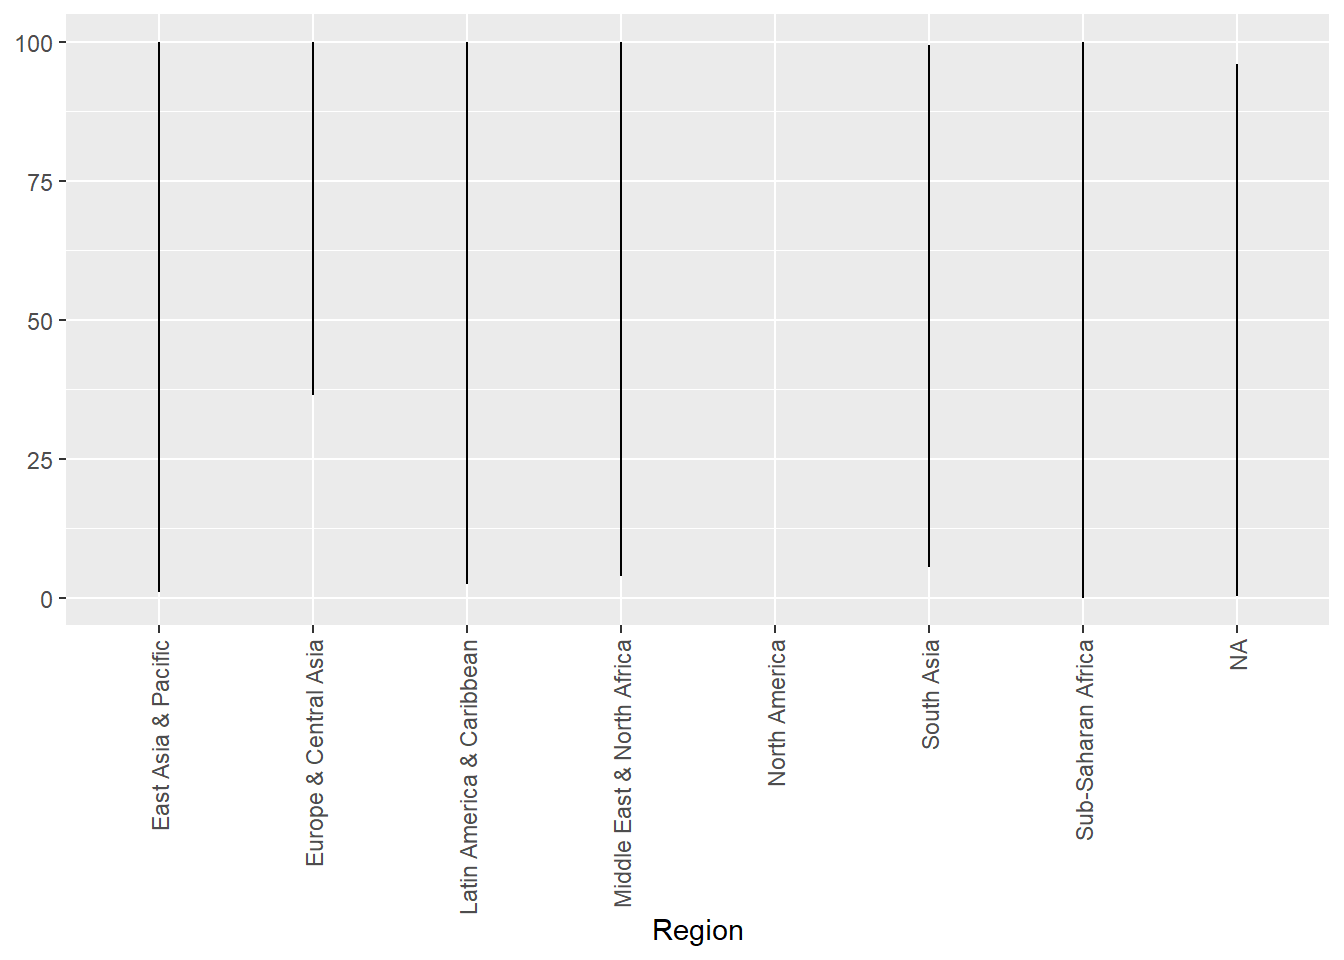
worldbankdata |>
  group_by(Region) |>
  summarise(min = min(Cooking, na.rm = TRUE), max=max(Cooking,
                                                      na.rm = TRUE)) |>
  ggplot(aes(x=Region)) +
  geom_linerange(aes(ymin = min, ymax = max)) +
  theme(axis.text.x = element_text(angle = 90, vjust = 0.5, hjust=1))