geom_outlier
Package
ggdemetra (Quartier-la-Tente 2024)
Description
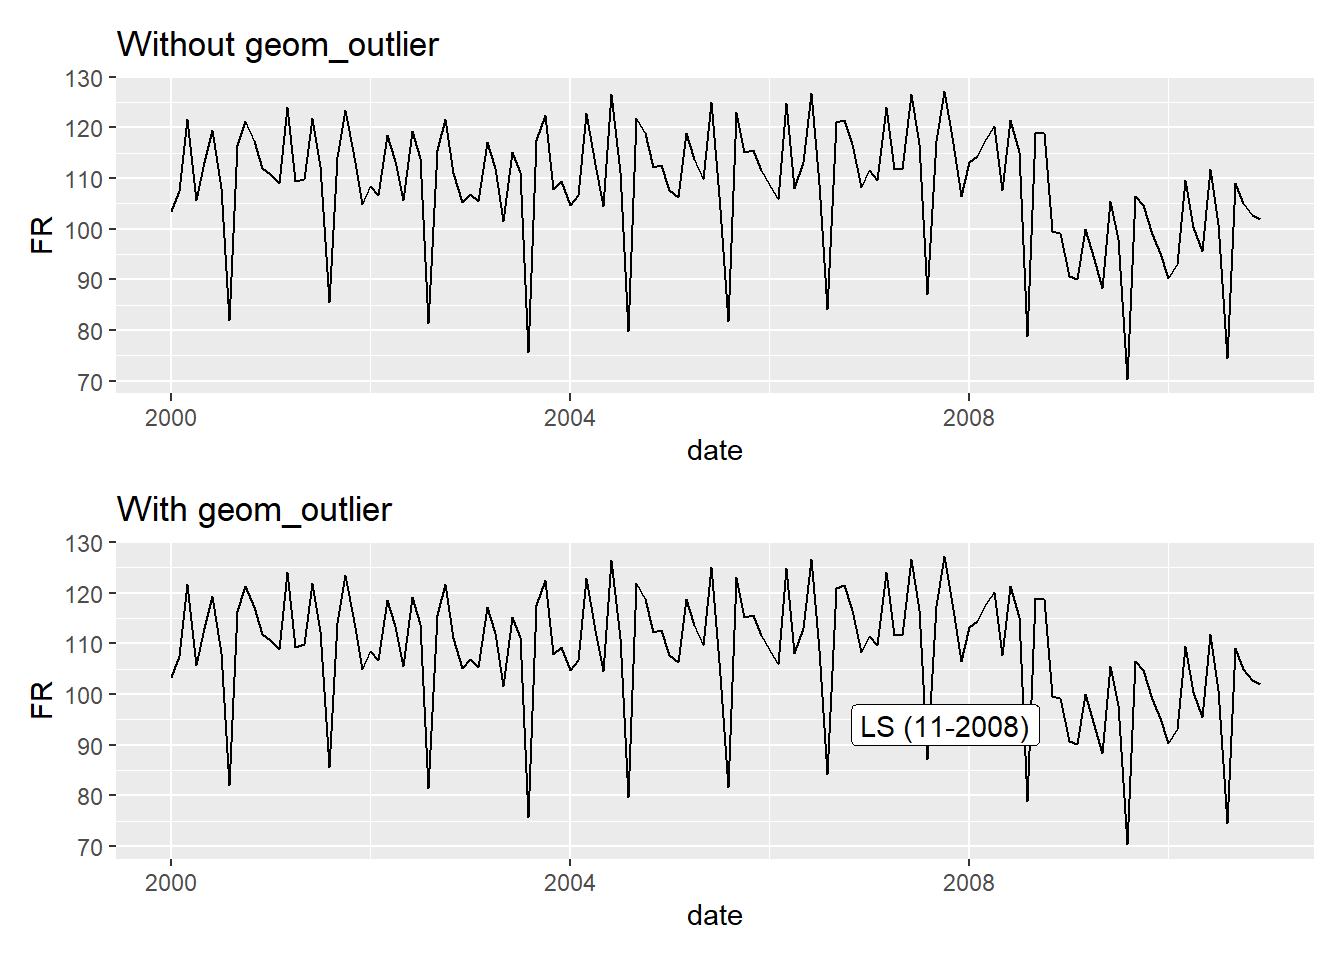
Function to add directly to the plot the outliers used in the pre-adjustment process of the seasonal adjustment.
Understandable aesthetics
required aesthetics
date
y
Note: frequency must be equal to 12, 6, 4 or 2
optional aesthetics
first_date, last_date, coefficients, digits, show.legend, inherit.aes
See also
geom_text, geom_label geom_text_repel, geom_label_repel
Example
#install.packages("RJDemetra")
#install.packages("ggdemetra")
library(RJDemetra)
library(ggdemetra)
ipi_c_eu <- window(ipi_c_eu, start = c(2000, 1), end = c(2010, 12))
ipi_c_eu_df <- ts2df(ipi_c_eu)
p1 <- ggplot(data = ipi_c_eu_df, mapping = aes(x = date, y = FR)) +
    geom_line() + ggtitle("Without geom_outlier")
p2 <- ggplot(data = ipi_c_eu_df, mapping = aes(x = date, y = FR)) +
    geom_line() + geom_outlier(geom = "label_repel") + ggtitle("With geom_outlier")
p1/p2
geom_outline
Package
ggplot2 (Wickham 2016)
Description
Understandable aesthetics
required aesthetics
x
y
optional aesthetics
alpha, colour, group, linetype, linewidth
See also
geom_line, geom_ribbon
Example
geom_outline_point
Package
ggplot2 (Wickham 2016)
Description
Understandable aesthetics
required aesthetics
x
y
optional aesthetics
alpha, colour, group, linetype, linewidth
See also
geom_line, geom_ribbon
Example
geom_overhang_seats
Package
ggparliament (ggparliament?)
Description
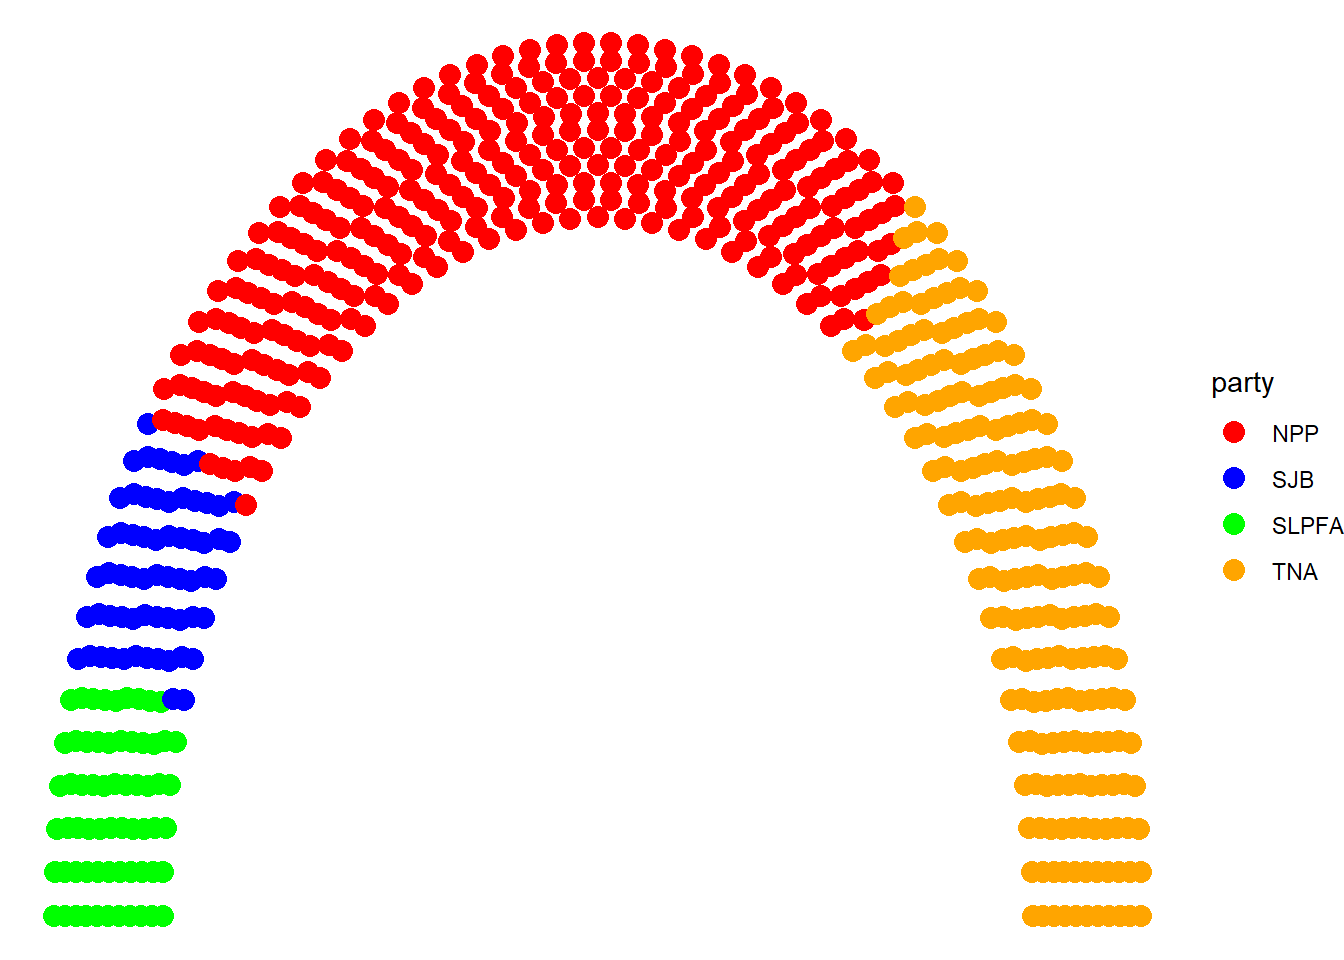
Draw overhang seats in mixed-member proportional (MMP) electoral systems
Understandable aesthetics
required aesthetics
expr
optional aesthetics
alpha, colour, group, linetype, linewidth
See also
geom_line, geom_ribbon
Example
#devtools::install_github("zmeers/ggparliament")
library(ggparliament)
sriLanka <- tibble(
  year = 2024,
  seats = c(64, 63, 311, 193),
  government = c(0, 0, 1, 1),
  colour = c("red", "blue", "green", "orange"),
  party = c("SLPFA",
            "SJB",
            "NPP",
            "TNA"))

sl_data <- parliament_data(
  election_data = sriLanka,
  parl_rows = 11,
  party_seats = sriLanka$seats,
  type = "horseshoe")

sl_data$overhang_seats <- rep(
  c(1, 0, 1, 0, 1, 0, 1, 0),
  c(295, 16, 11, 182, 3, 61, 3, 60)
)
ggplot(sl_data, aes(x, y, colour = party)) +
  geom_parliament_seats() +
  geom_overhang_seats(overhang_seats == 0.2) +
  theme_ggparliament() +
  scale_colour_manual(values = c("red", "blue", "green", "orange"))
Quartier-la-Tente, Alain. 2024.
Ggdemetra: ’Ggplot2’ Extension for Seasonal and Trading Day Adjustment with ’RJDemetra’.
https://CRAN.R-project.org/package=ggdemetra.
Wickham, Hadley. 2016.
Ggplot2: Elegant Graphics for Data Analysis. Springer-Verlag New York.
https://ggplot2.tidyverse.org.