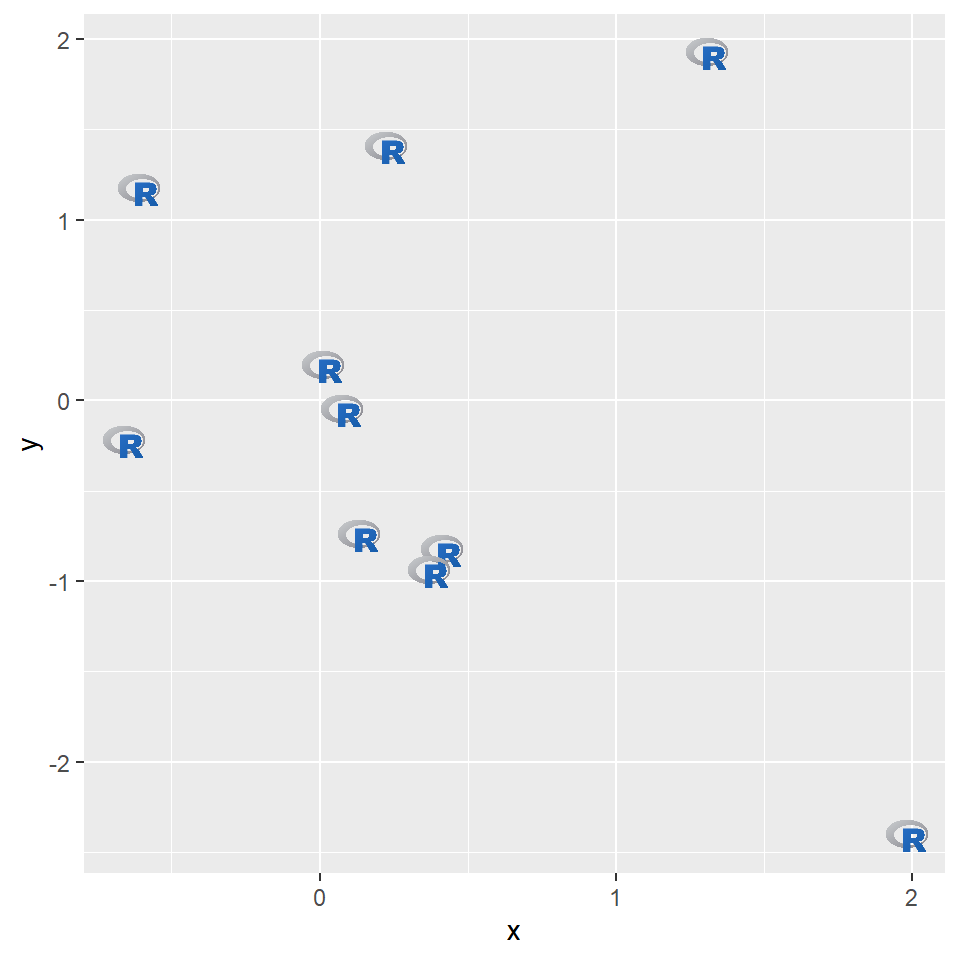
geom_image
Package
ggimage (Yu 2023)
Description
Visualise data through images.
Understandable aesthetics
image
See also
geom_emoji
Example
library("ggimage")
df <- data.frame(x = rnorm(10),
                 y = rnorm(10),
                image = sample("https://www.r-project.org/logo/Rlogo.png",
                              size=10, replace = TRUE))
ggplot(df, aes(x, y)) + geom_image(aes(image=image))
geom_icon
Example
library("ggimage")
df <- data.frame(x = rnorm(10),
                 y = rnorm(10))
df$icon = sample(c('ios-power', 'ios-wifi', 'ios-pie'), 10, replace=TRUE)
ggplot(df, aes(x, y)) + geom_icon(aes(image=icon))
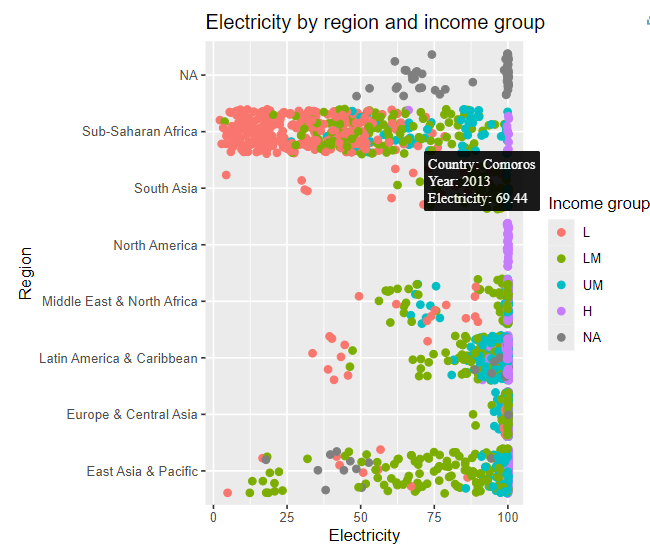
geom_jitter_interactive
Package
ggiraph (ggiraph?)
Description
Adds interactive features like tooltips and hyperlinks, allowing for dynamic exploration of jittered data points in a plot.
Understandable aesthetics
required aesthetics
x
y
optional aesthetics
alpha, colour, group, linetype, linewidth
See also
geom_point, geom_ribbon
Example
library(ggiraph)
p <- ggplot(worldbankdata, aes(y = Region, x = Electricity, color = Income)) +
  geom_jitter_interactive(aes(tooltip = paste("Country:", Country,
                                              "<br>Year:", Year,
                                              "<br>Electricity:", Electricity)),
                          size = 2, width = 0.3) +
  labs(title = "Electricity by region and income group",
      y = "Region",
       x = "Electricity",
       color = "Income group")
x <- girafe(ggobj = p)
if( interactive() ) print(x)
Yu, Guangchuang. 2023.
Ggimage: Use Image in ’Ggplot2’.
https://CRAN.R-project.org/package=ggimage.