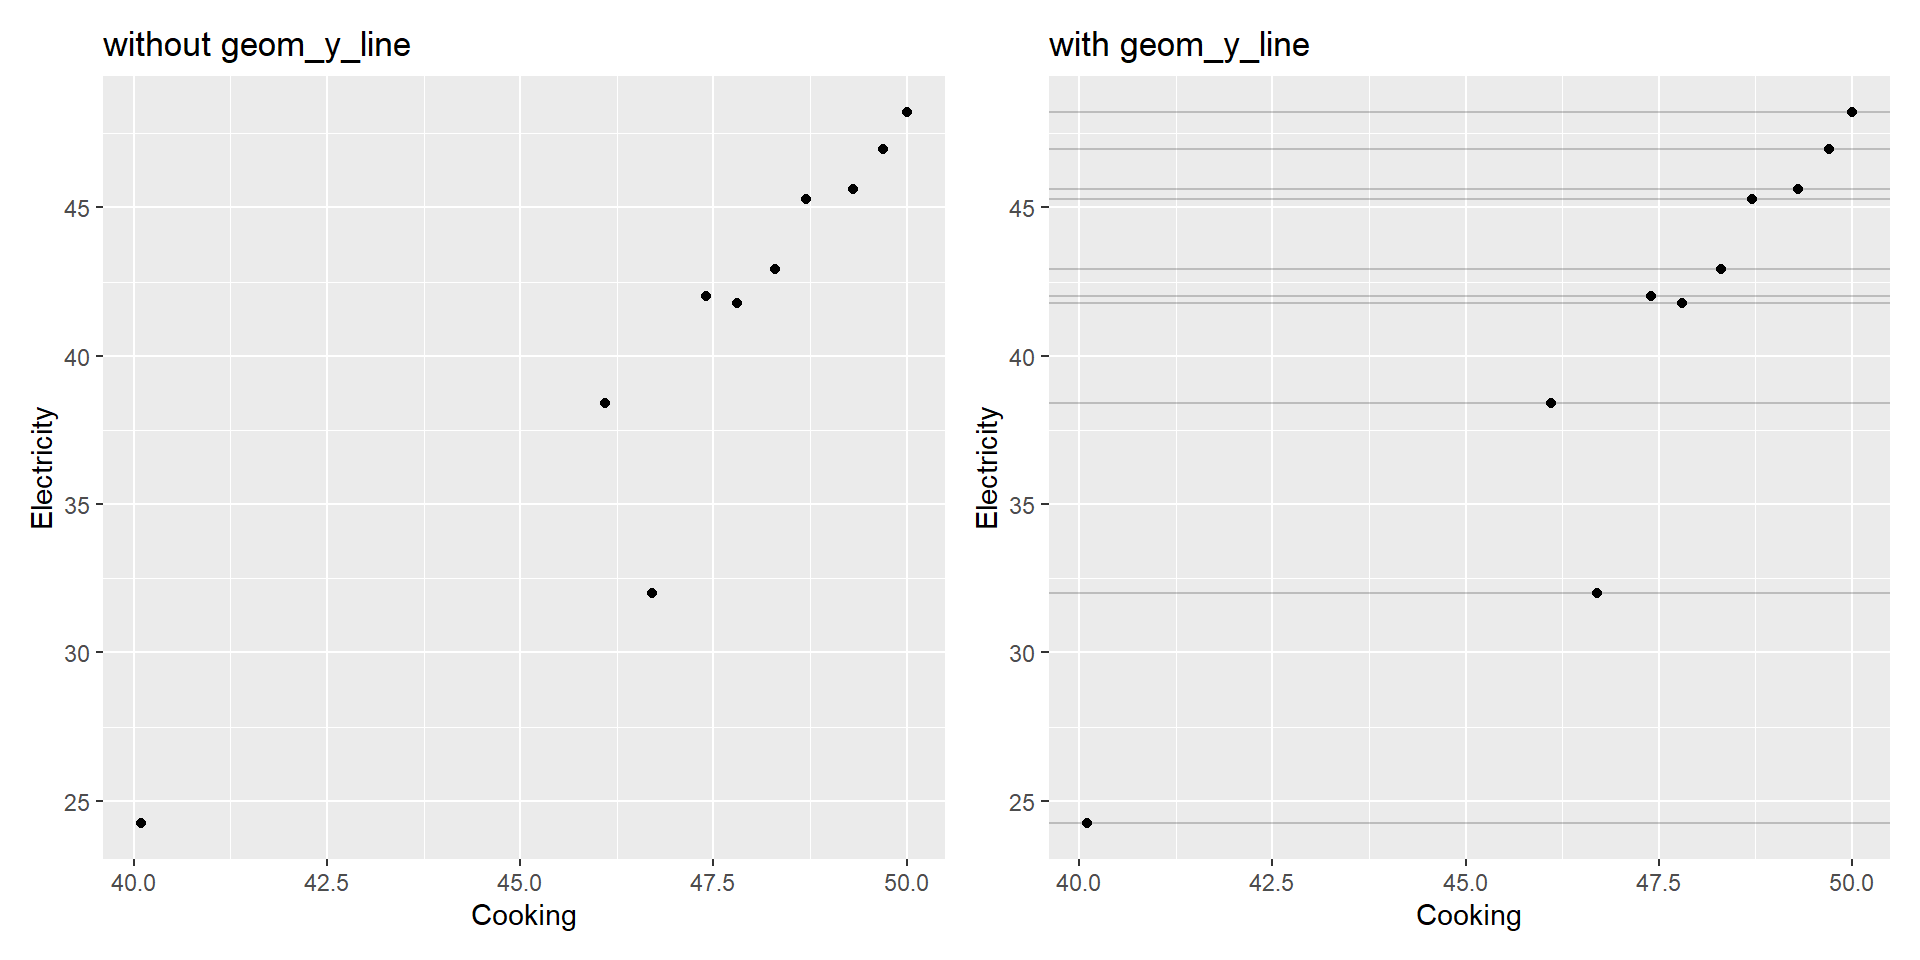
geom_y_line
Package
ggxmean (Reynolds 2024)
Description
Create horizontal lines representing the specified value of the y variable across the x values in the data.
Understandable aesthetics
required aesthetics
x
y
optional aesthetics
alpha, colour, group, linetype, linewidth
See also
geom_ydiff, geom_line
Example
library(ggxmean)
p1 <- worldbankdata |>
  filter(Country == "Angola") |>
  ggplot(mapping = aes(x = Cooking, y = Electricity)) +
geom_point()  + ggtitle("without geom_y_line")
p2 <- worldbankdata |>
  filter(Country == "Angola") |>
  ggplot(mapping = aes(x = Cooking, y = Electricity)) +
geom_point() + geom_y_line(alpha = .2) +
  ggtitle("with geom_y_line")
p1|p2
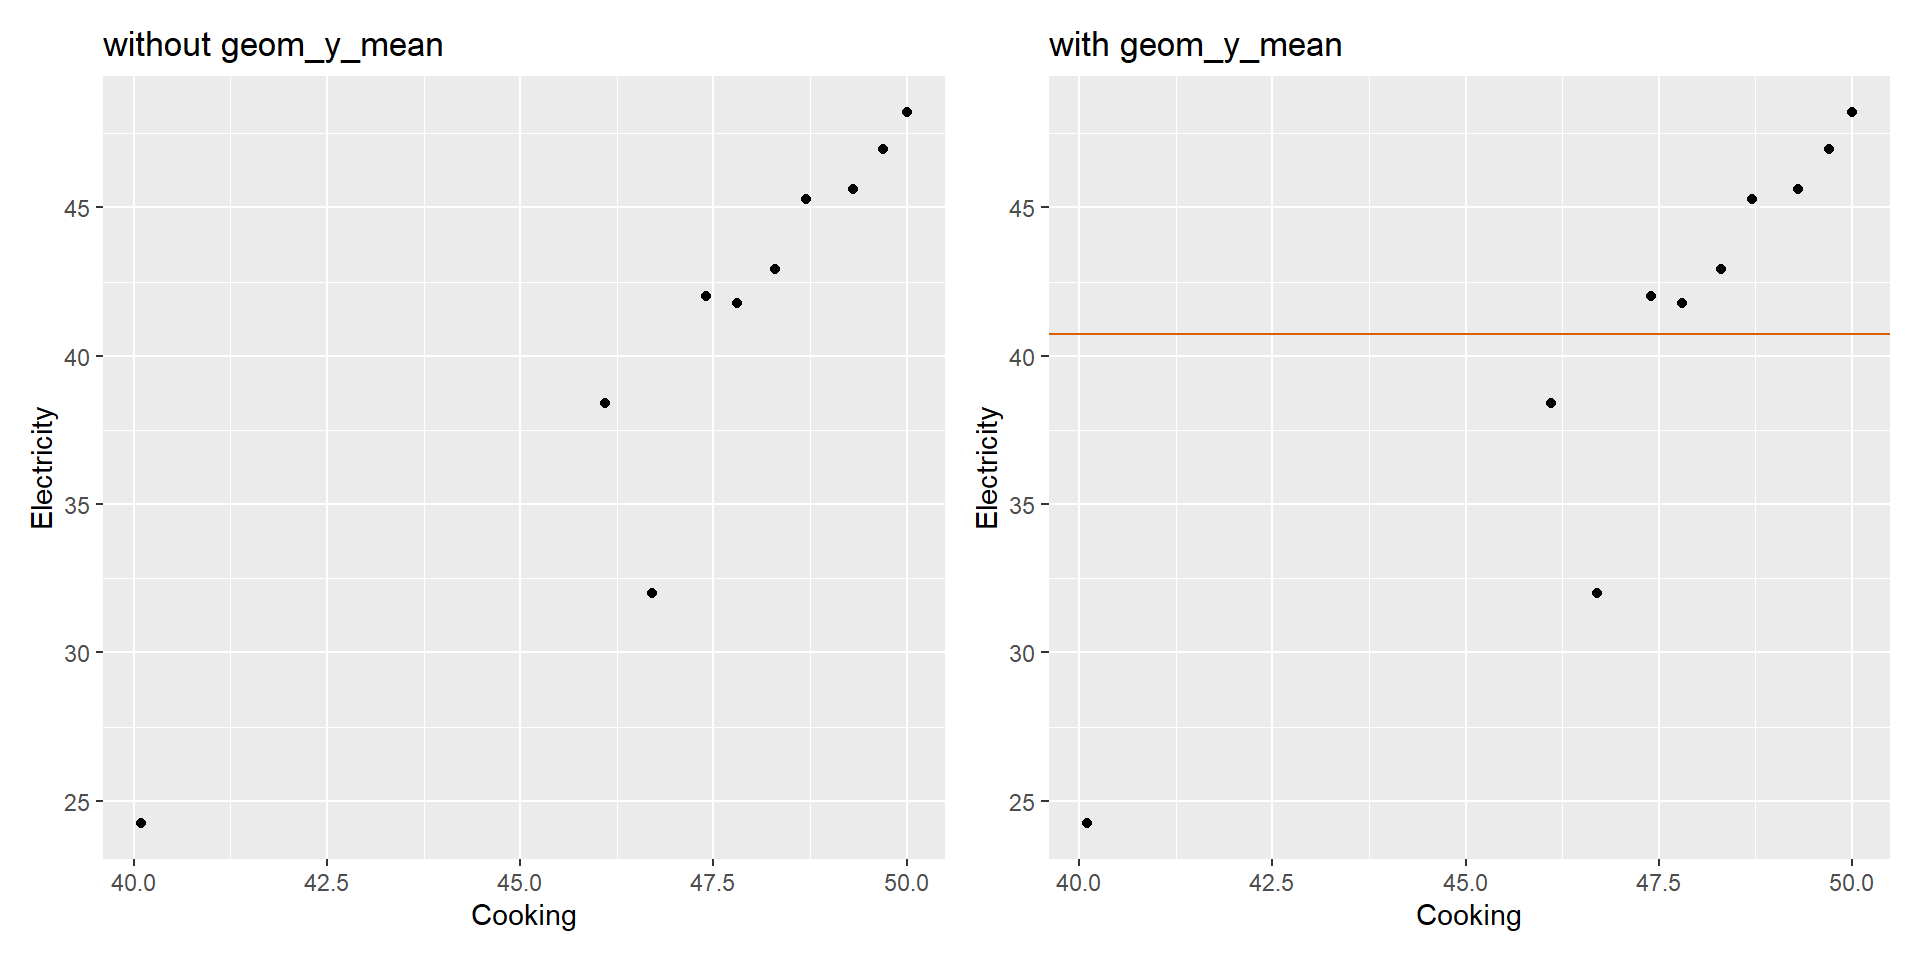
geom_y_mean
Package
ggxmean (Reynolds 2024)
Description
Draw a horizontal line at the mean of y-variable.
Understandable aesthetics
required aesthetics
x
y
optional aesthetics
alpha, colour, group, linetype, linewidth
See also
geom_line, geom_ribbon geom_y_line
Example
library(ggxmean)
p1 <- worldbankdata |>
  filter(Country == "Angola") |>
  ggplot(mapping = aes(x = Cooking, y = Electricity)) +
geom_point()  + ggtitle("without geom_y_mean")
p2 <- worldbankdata |>
  filter(Country == "Angola") |>
  ggplot(mapping = aes(x = Cooking, y = Electricity)) +
geom_point() + geom_y_mean(colour="#d95f02") +
  ggtitle("with geom_y_mean")
p1|p2
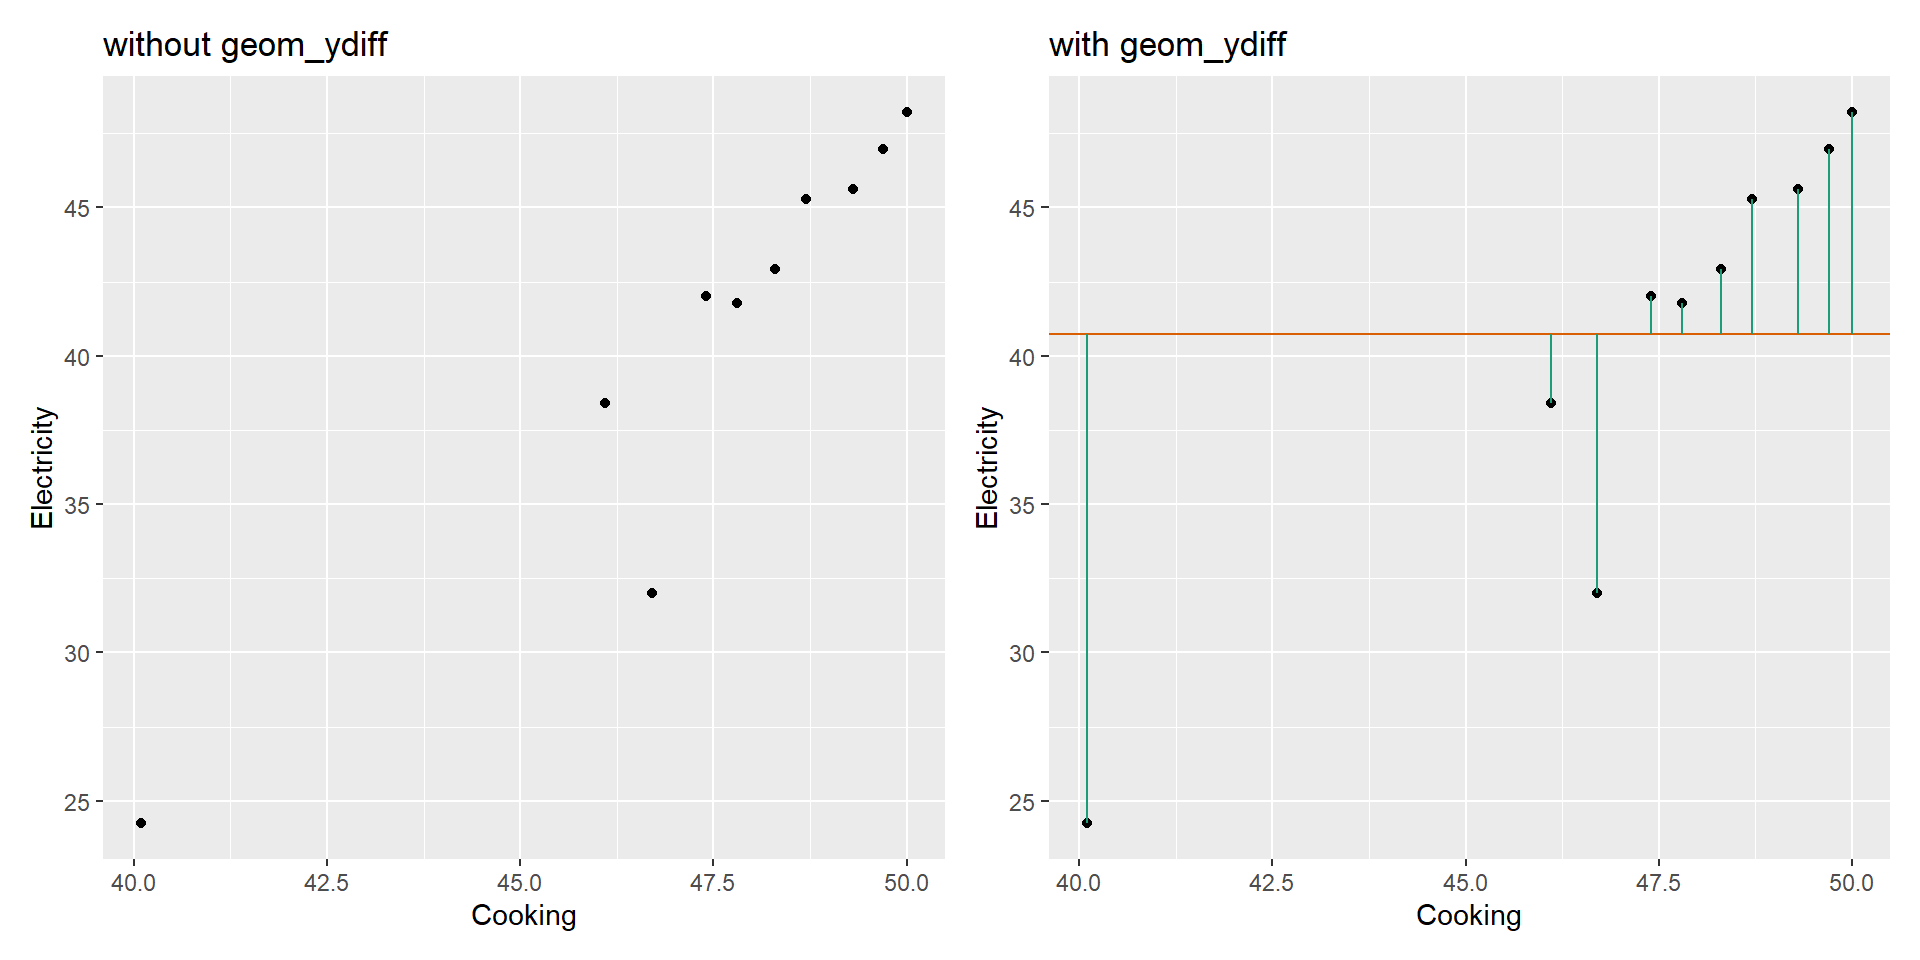
geom_ydiff
Package
ggplot2 (Wickham 2016)
Description
Understandable aesthetics
required aesthetics
x
y
optional aesthetics
alpha, colour, group, linetype, linewidth
See also
geom_line, geom_ribbon geom_y_line
Example
library(ggxmean)
p1 <- worldbankdata |>
  filter(Country == "Angola") |>
  ggplot(mapping = aes(x = Cooking, y = Electricity)) +
geom_point()  + ggtitle("without geom_ydiff")
p2 <- worldbankdata |>
  filter(Country == "Angola") |>
  ggplot(mapping = aes(x = Cooking, y = Electricity)) +
geom_point() +
  geom_y_mean(col="#d95f02")+ggxmean:::geom_ydiff(colour="#1b9e77") +
  ggtitle("with geom_ydiff")
p1|p2
Reynolds, Evangeline. 2024. Ggxmean: Statistical Geoms.
Wickham, Hadley. 2016.
Ggplot2: Elegant Graphics for Data Analysis. Springer-Verlag New York.
https://ggplot2.tidyverse.org.