worldbankdata |>
  ggplot(aes(sample = Cooking)) +
  geom_qq()
Warning: Removed 6047 rows containing non-finite outside the scale range
(`stat_qq()`).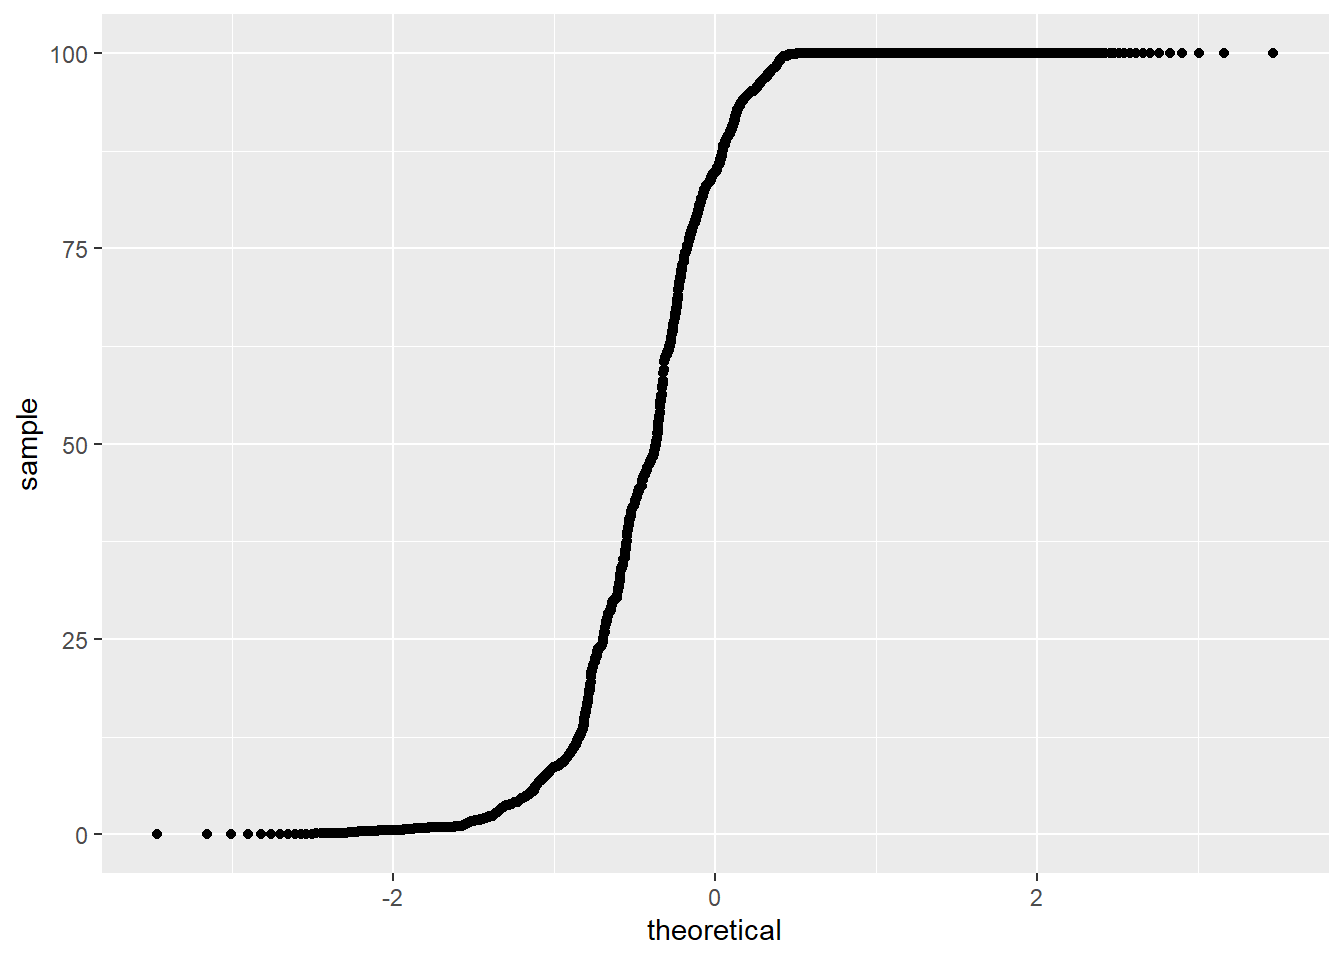
Package
ggplot2 (Wickham 2016)
Description
Draws quantitle-quantile plot.
Understandable aesthetics
required aesthetics
sample
optional aesthetics
group, x, y
See also
Example
worldbankdata |>
ggplot(aes(sample = Cooking)) +
geom_qq()Warning: Removed 6047 rows containing non-finite outside the scale range
(`stat_qq()`).
Package
ggplot2 (Wickham 2016)
Description
Computes the slope and intercept of the line connecting the points at specified quartiles of the theoretical and sample distribution in the quantitle-quantile plot. This geom should be used along with geom_qq to plot to be meaningful.
Understandable aesthetics
required aesthetics
sample
optional aesthetics
group, x, y
See also
Example
a1 <- worldbankdata |>
  ggplot(aes(sample = Cooking)) +
  geom_qq_line()  + ggtitle("geom_qq_line only")
a2 <- worldbankdata |>
  ggplot(aes(sample = Cooking)) +
  geom_qq_line() + geom_qq() + ggtitle("geom_qq_line and geom_qq")
a1|a2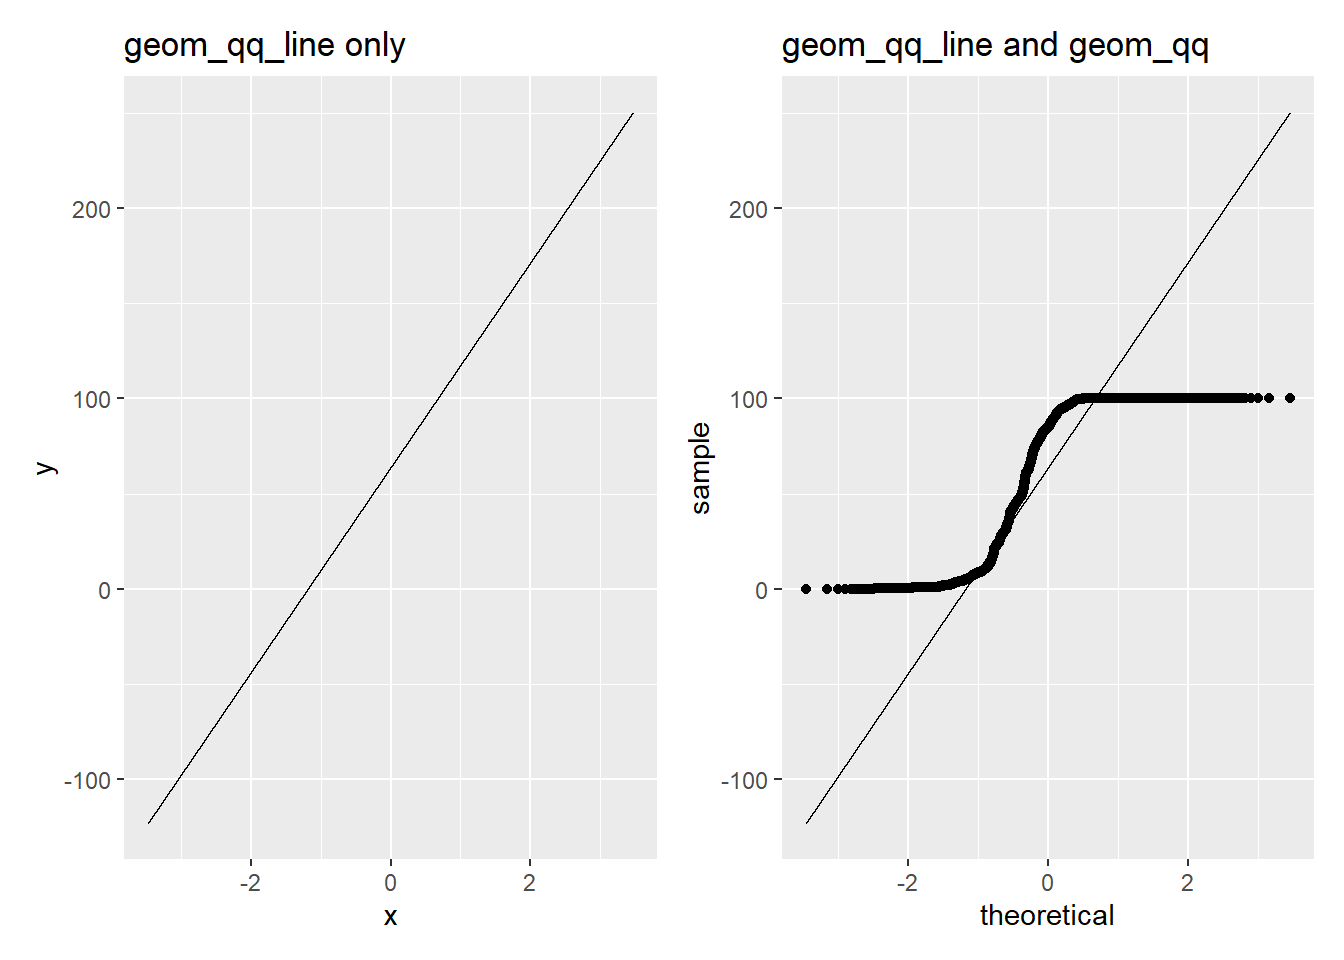
Package
ggplot2 (Wickham 2016)
Description
Fits and draw quantile regression lines. Quantile regression models the relationship between independent variables and the percentiles of the dependent variable
Understandable aesthetics
required aesthetics
x, y
optional aesthetics
alpha, colour, group, linetype, linewidth, weight, quantile, method
See also
Examples
Example 1
a1 <- worldbankdata |>
  ggplot(aes(y=Cooking, x = Electricity)) +
  geom_quantile() + ggtitle("geom_quantile only")
a2 <- worldbankdata |>
  ggplot(aes(y=Cooking, x = Electricity)) +
  geom_quantile() +
  geom_point() +
  ggtitle("geom_quantile and geom_point")
a1|a2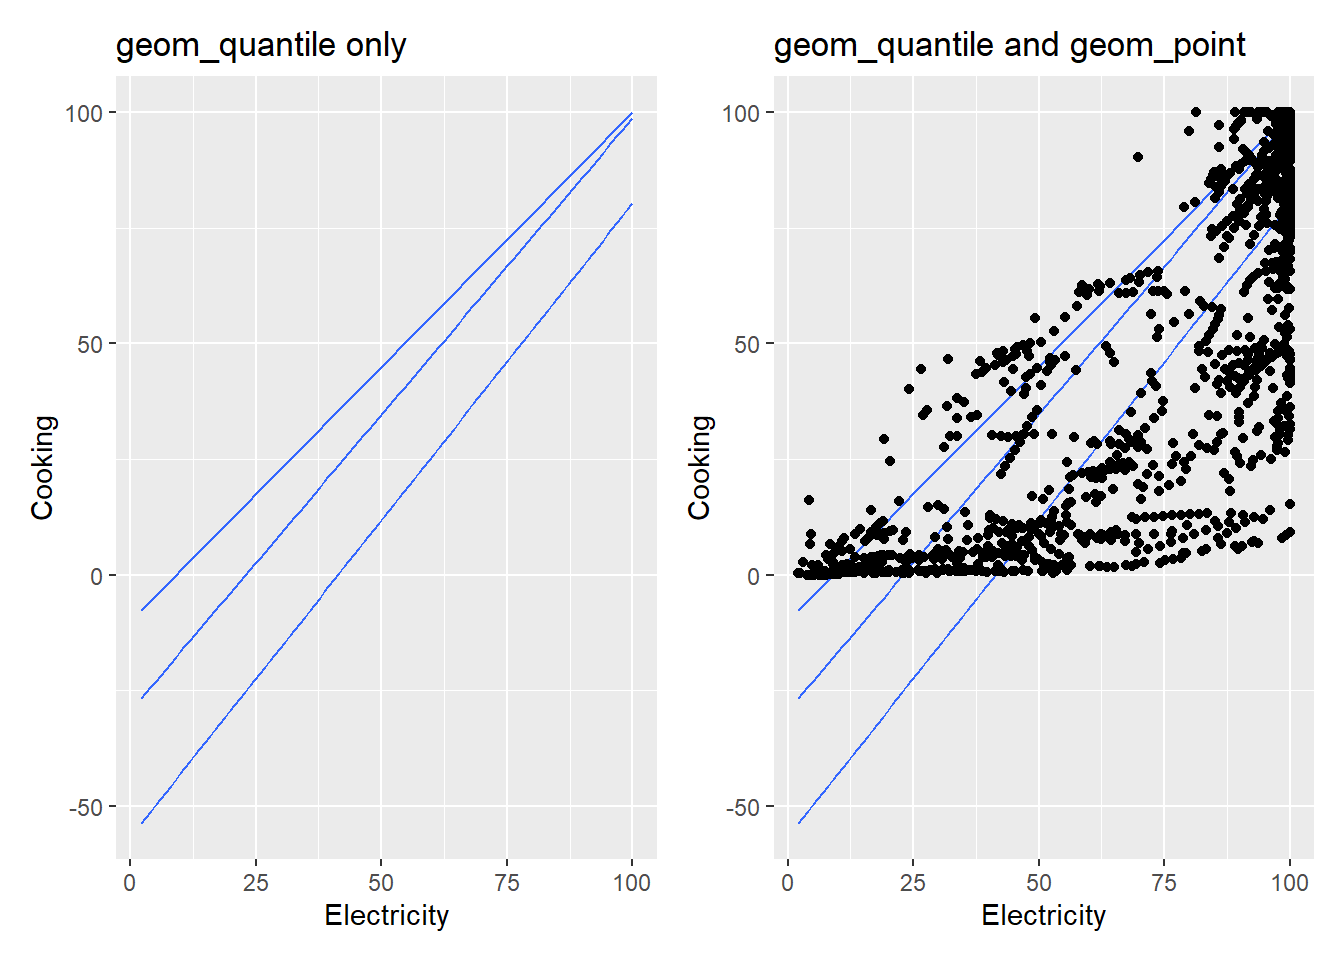
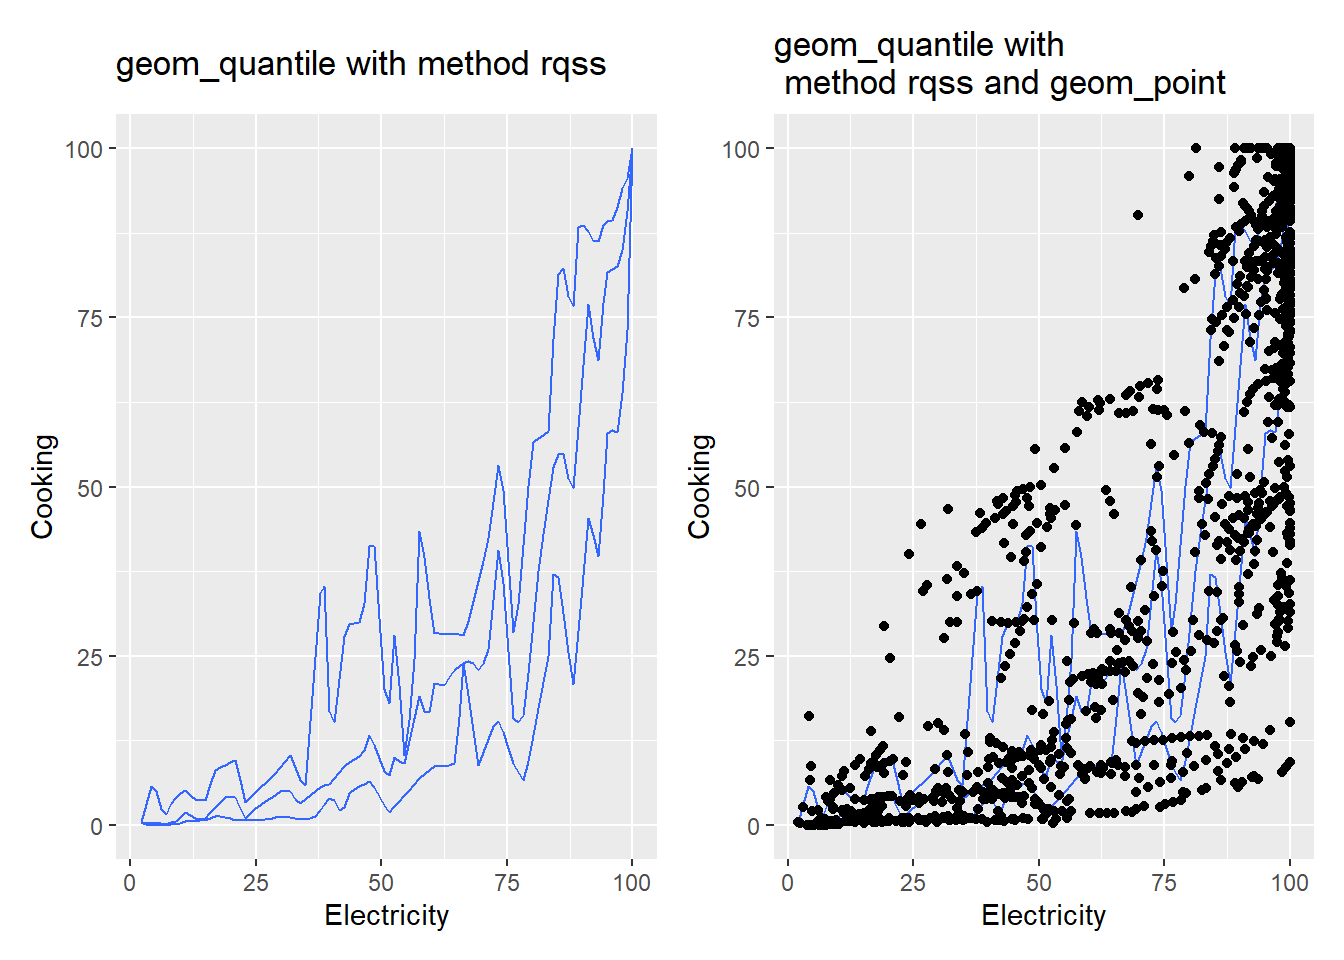
Example 2
q <- seq(0.05, 0.95, by = 0.05)
a3 <- worldbankdata |>
  ggplot(aes(y=Cooking, x = Electricity)) +
  geom_quantile(method = "rqss") +
  ggtitle("geom_quantile with method rqss")
a4 <- worldbankdata |>
  ggplot(aes(y=Cooking, x = Electricity)) +
  geom_quantile(method = "rqss") +
  geom_point() +
  ggtitle("geom_quantile with \n method rqss and geom_point")
a3|a4