geom_hline
Package
ggplot2 (Wickham 2016 )
Description
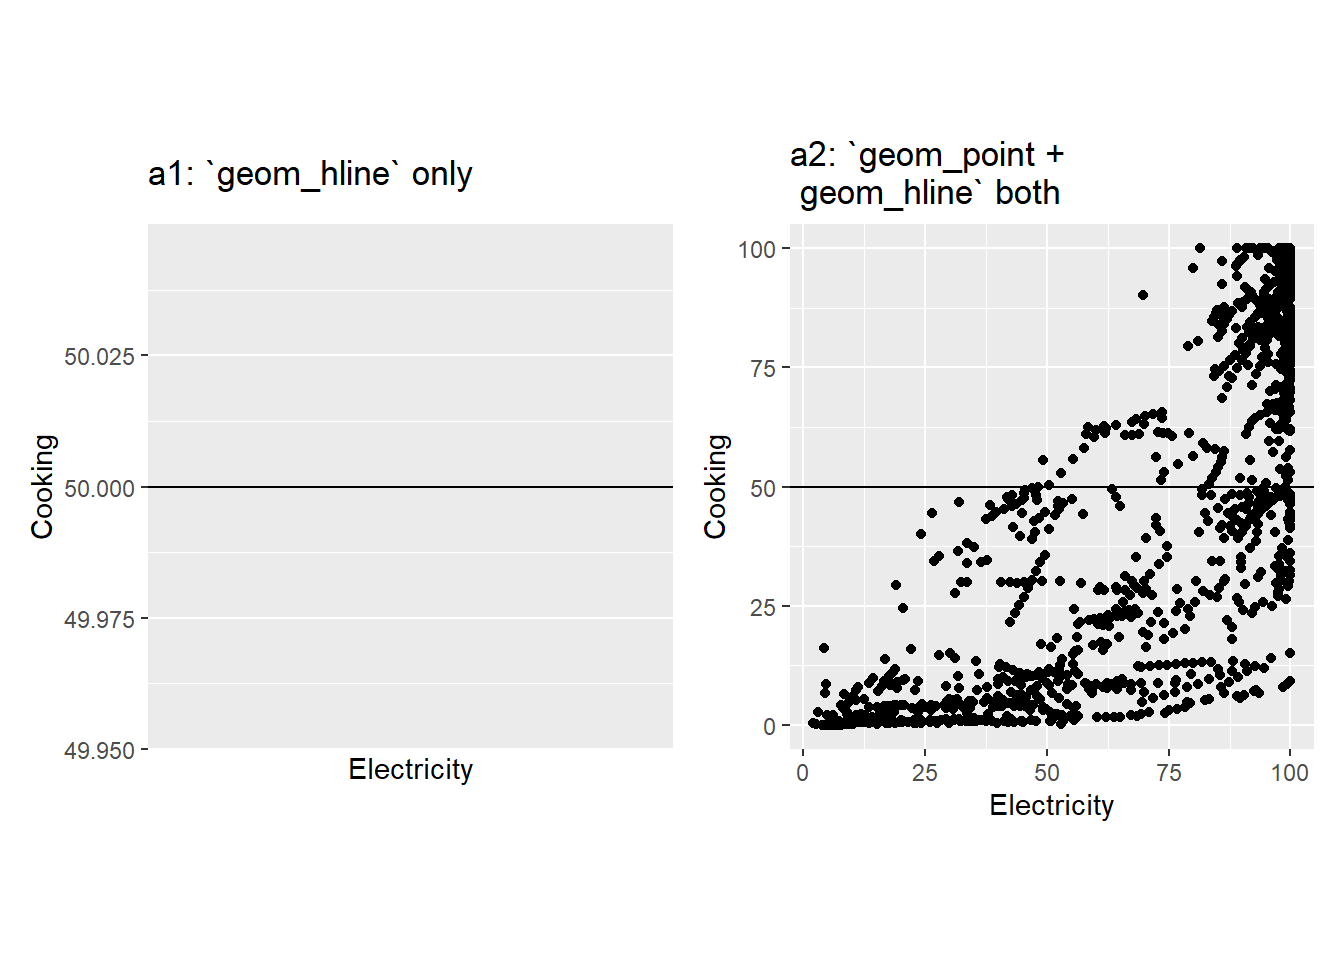
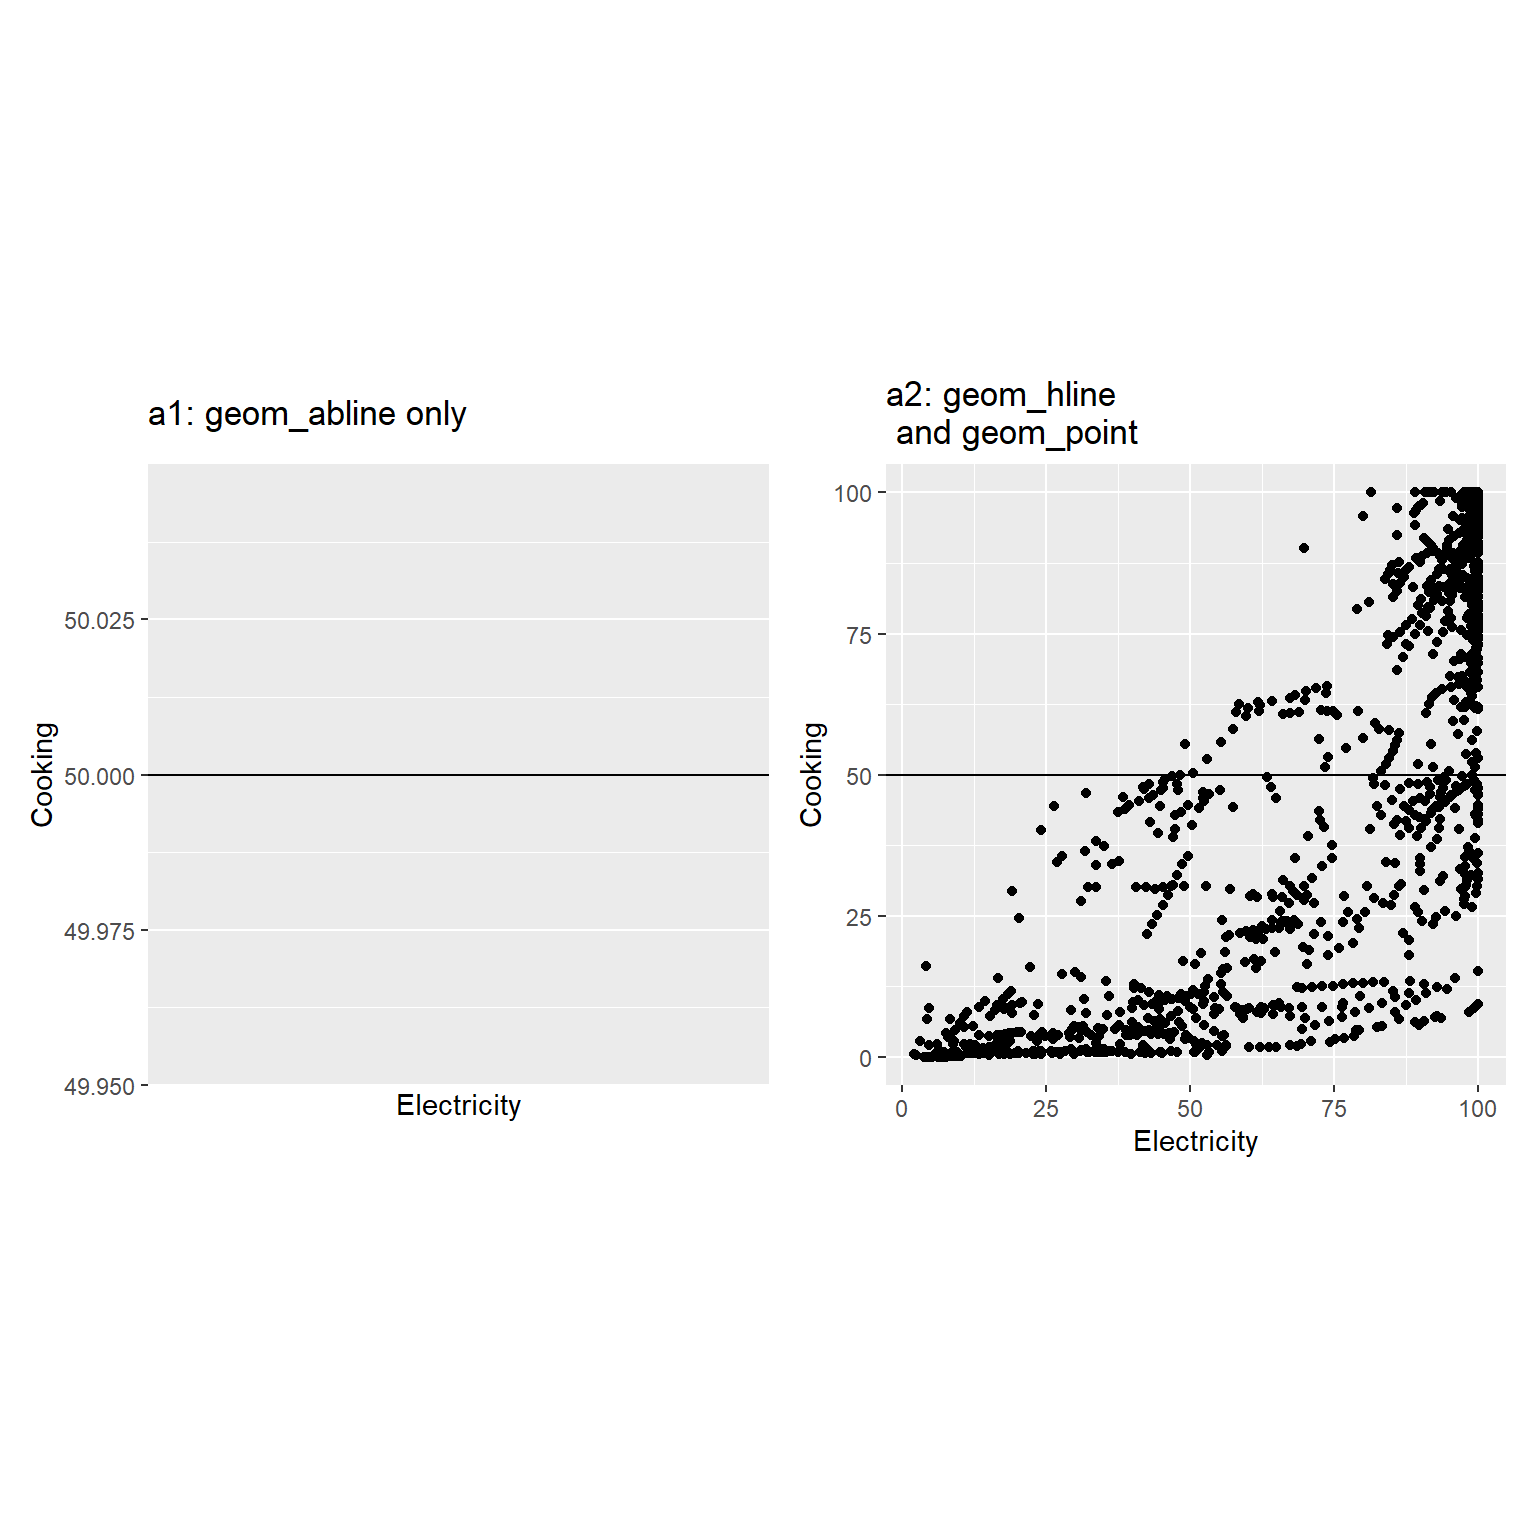
Draw a horizontal line (\(Y=c\) ) for a given value of \(c\) , which is known as yintercept.
Understandable aesthetics
Unlike most other geoms, geom_hline does not depend on the x and y variables that we map for the main plot. geom_hline has its own independent characteristics: yintercept. The yintercept can be passed either as a arguments or aesthetic.
See also
geom_point , geom_vline , geom_hline
Example
<- ggplot (worldbankdata, aes (y = Cooking, x= Electricity)) + geom_hline (yintercept = 50 ) + labs (title= "a1: `geom_hline` only" ) + theme (aspect.ratio = 1 )<- ggplot (worldbankdata, aes (y = Cooking, x= Electricity)) + geom_point () + geom_hline (yintercept = 50 ) + labs (title= "a2: `geom_point + \n geom_hline` both" ) + theme (aspect.ratio = 1 )| a2
geom_histogram
Package
ggplot2 (Wickham 2016 )
Description
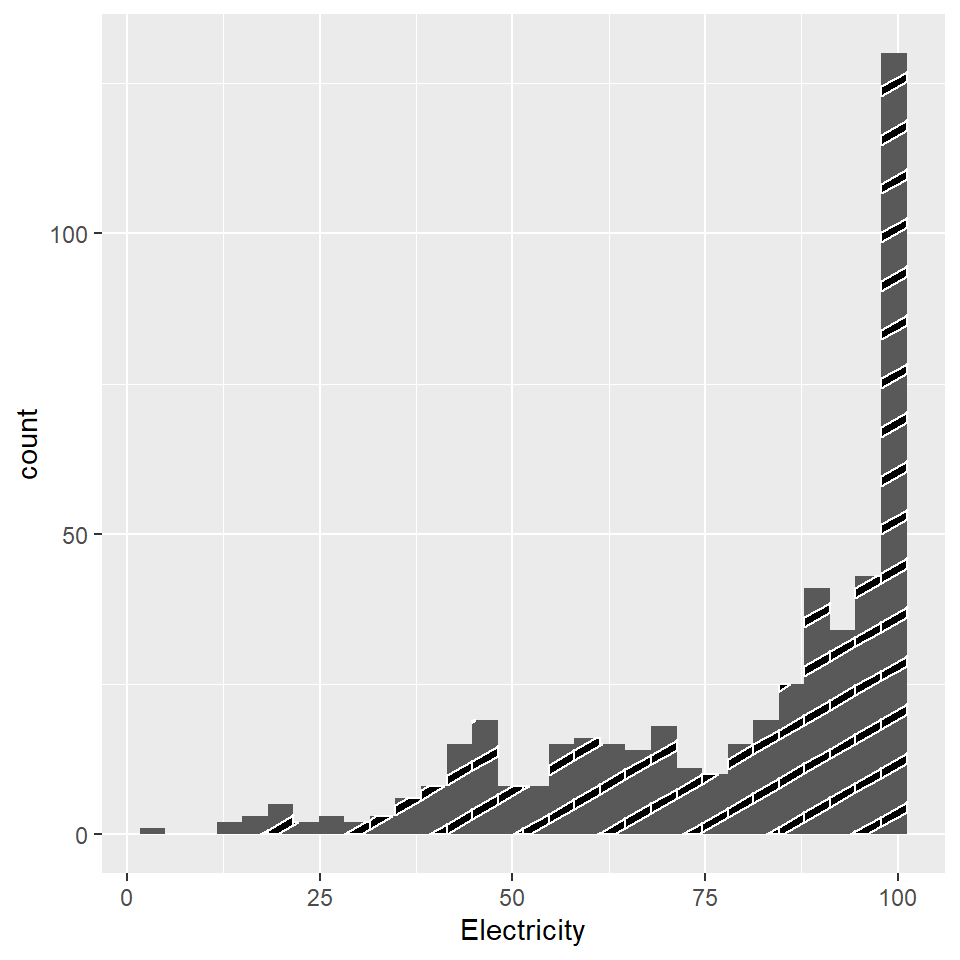
Visualise data using histogram.
Understandable aesthetics
Unlike most other geoms, geom_hline does not depend on the x and y variables that we map for the main plot. geom_hline has its own independent characteristics: yintercept. The yintercept can be passed either as a arguments or aesthetic.
See also
geom_density , geom_density_line , geom_freqpoly
Example
|> filter (Income == "LM" ) |> ggplot (aes (x = Electricity)) + geom_histogram (col= "white" )
geom_histogram_pattern
Package
ggplot2 (Wickham 2016 )
Description
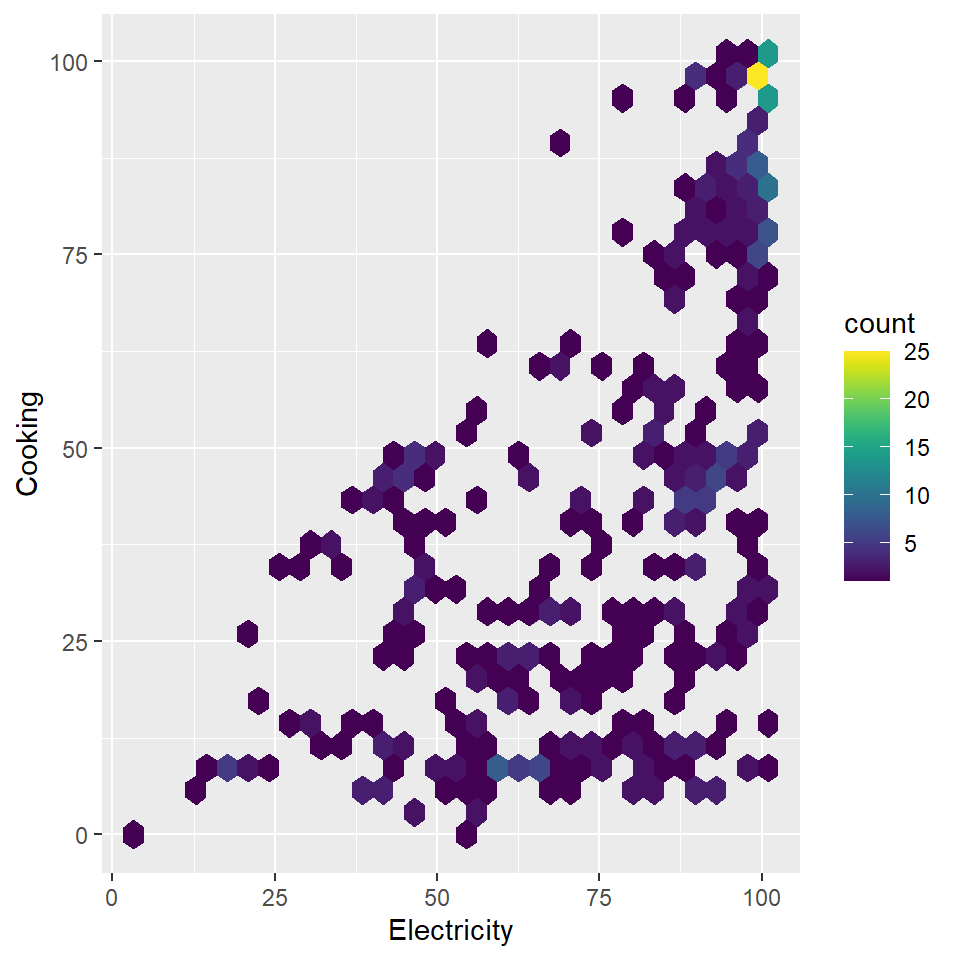
Visualize numeric data using histogram and filled with patterns.
Understandable aesthetics
required aesthetics
x or y
optional aesthetics
alpha, colour, group, linetype, linewidth
See also
geom_histogram , geom_density , geom_density_line
Example
|> filter (Income == "LM" ) |> ggplot (aes (x = Electricity)) + geom_histogram_pattern ( pattern_color = "white" ,pattern_fill = "black" )
geom_hdr_boxplot
Package
gghdr (gghdr?
Description
Calculates and plots the box plot of highest density regions.
Understandable aesthetics
required aesthetics
x or y
optional aesthetics
alpha, colour
See also
geom_boxplot , geom_histogram , geom_density , geom_density_line
Example
library (gghdr)|> :: filter (Year == 2021 ) |> :: select (Cooking) |> ggplot (aes (y = Cooking, x= factor (0 ))) + geom_hdr_boxplot (fill = "#081d58" )
geom_hex
Package
gghdr (gghdr?
Description
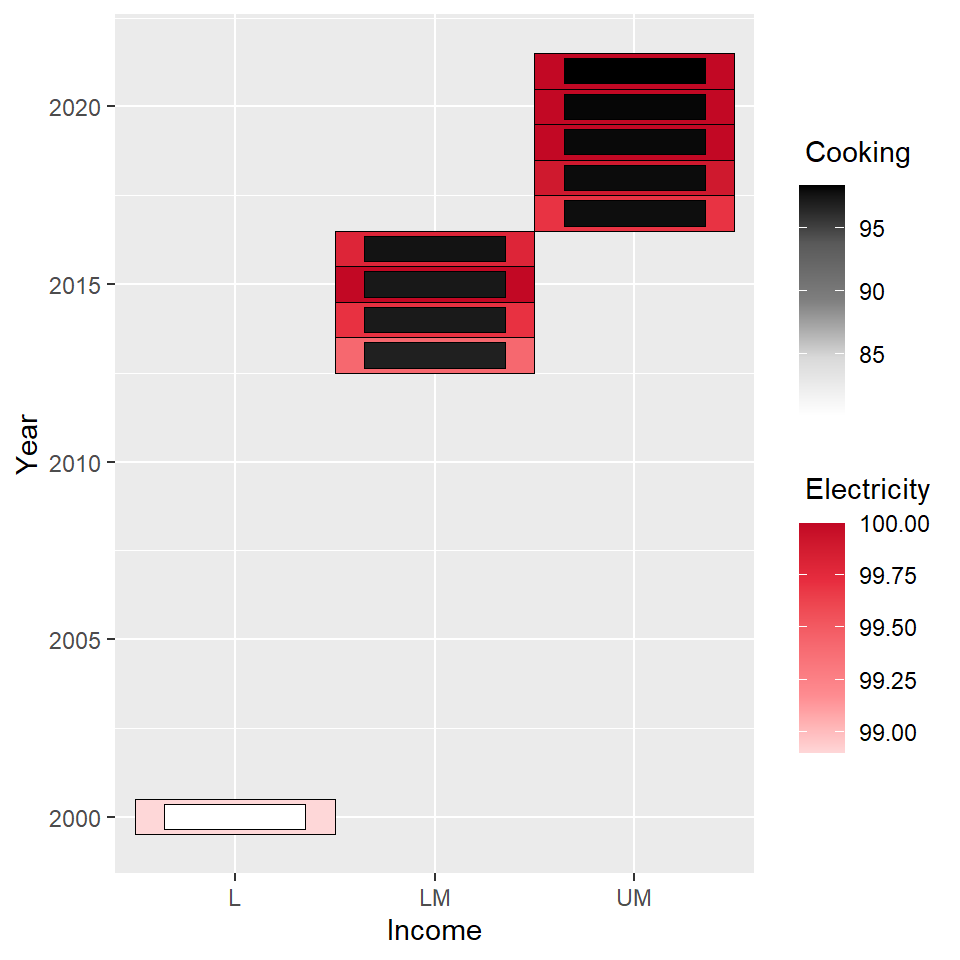
Calculates and plots the box plot of highest density regions.
Understandable aesthetics
required aesthetics
x or y
optional aesthetics
alpha, colour, fill, group, linetype, linewidth
See also
geom_boxplot , geom_histogram , geom_density , geom_density_line
Example
library (hexbin)library (viridis)|> filter (Income == "LM" ) |> ggplot (aes (y = Cooking, x= Electricity)) + geom_hex () + scale_fill_viridis ()
geom_heat_grid
Package
ggDoubleHeat (Yu and Buskirk 2023 )
Description
Visualize two quantitative variables of information inside a heatmap cell using a grid.
Understandable aesthetics
required aesthetics
x, y, outside, inside
Optional aesthetics
outside_colors, outside_name, inside_colors, inside_name
See also
geom_heat_circle , geom_heat_tri
Example
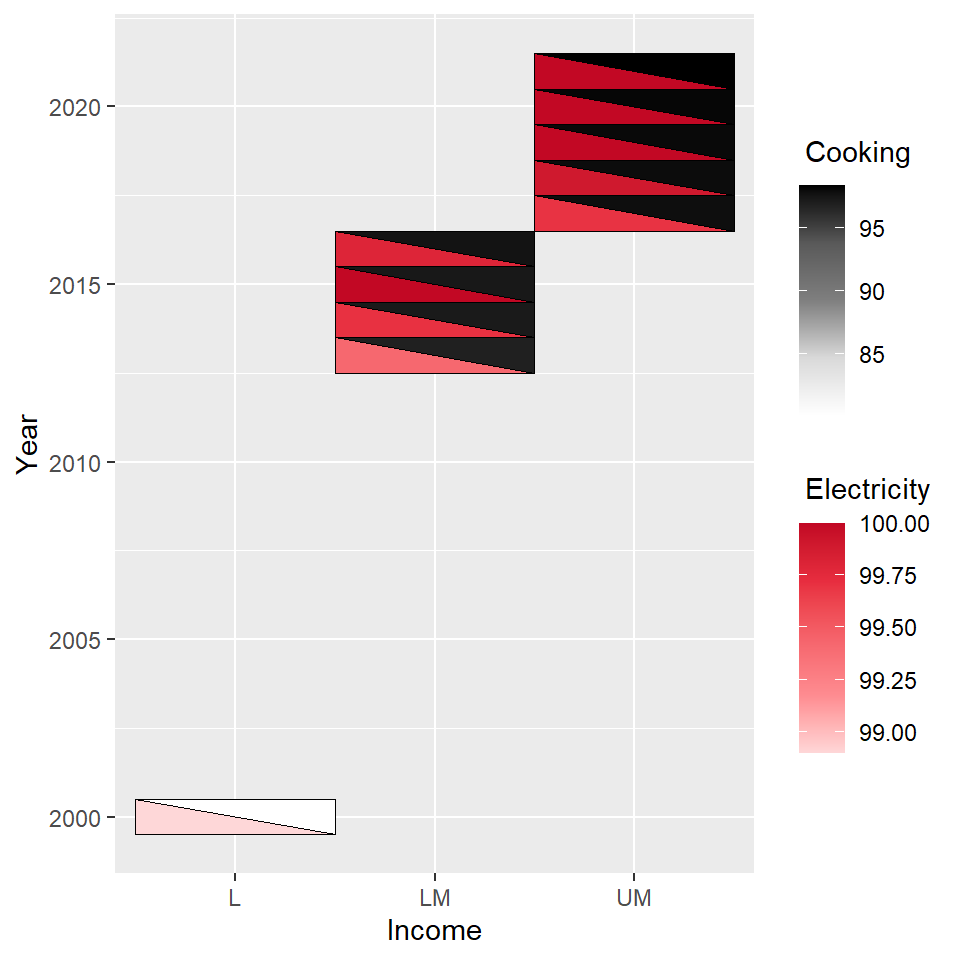
library (ggDoubleHeat)254 : 263 , ] |> ggplot (aes (y = Year, x= Income)) + geom_heat_grid (outside = Electricity,inside = Cooking)
geom_heat_tri
Package
ggDoubleHeat (Yu and Buskirk 2023 )
Description
Visualize two quantitative variables of information inside a heatmap cell using triangles.
Understandable aesthetics
required aesthetics
x, y, lower, upper
Optional aesthetics
lower_colors, lower_name, upper_colors, upper_name
See also
geom_heat_grid , geom_heat_tri
Example
library (ggDoubleHeat)254 : 263 , ] |> ggplot (aes (y = Year, x= Income)) + geom_heat_tri (lower = Electricity,upper = Cooking)
geom_heat_circle
Package
ggDoubleHeat (Yu and Buskirk 2023 )
Description
Visualize two quantitative variables of information inside a heatmap cell using triangles.
Understandable aesthetics
required aesthetics
x, y, outside, inside
Optional aesthetics
outside_colors, outside_name, inside_colors, inside_name
See also
geom_heat_grid , geom_heat_tri
Example
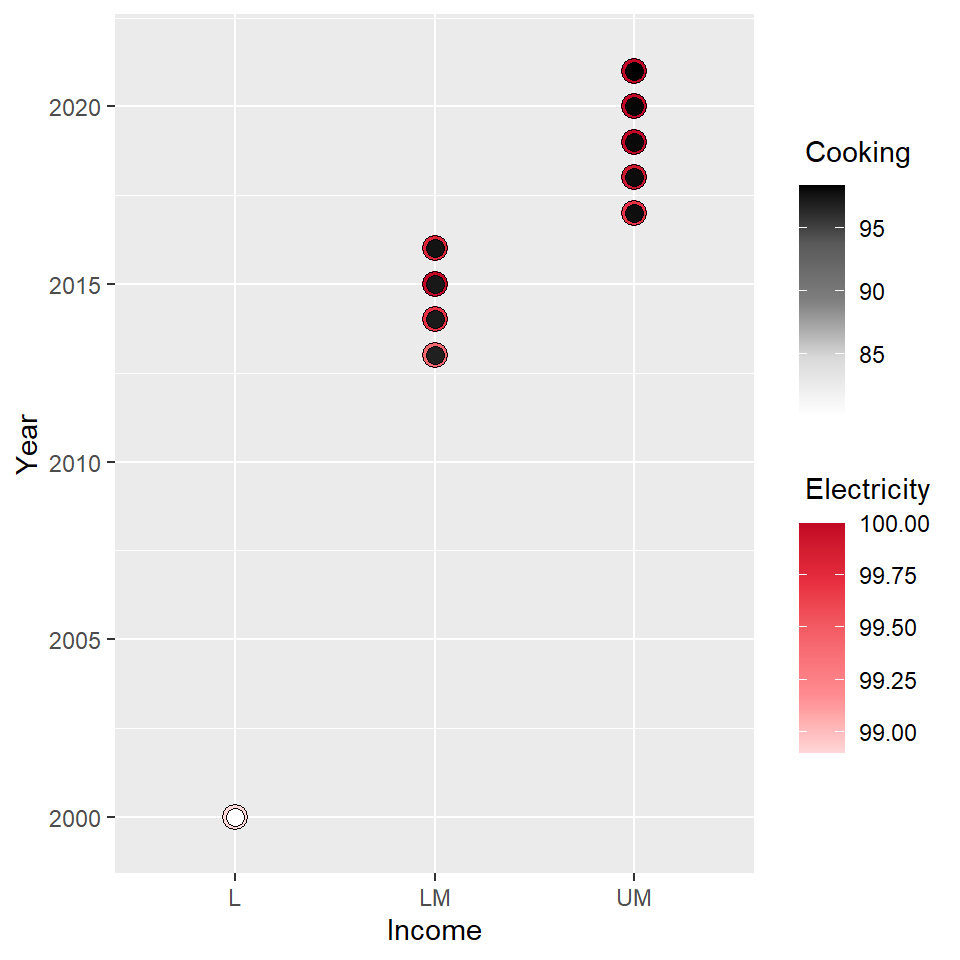
library (ggDoubleHeat)254 : 263 , ] |> ggplot (aes (y = Year, x= Income)) + geom_heat_circle (outside = Electricity,inside = Cooking)
geom_hline
Package
ggplot2 (Wickham 2016 )
Description
Draw a horizontal line given intercept.
Understandable aesthetics
Unlike most other geoms, geom_hline does not depend on the x and y variables that we map for the main plot.
See also
geom_point , geom_vline , geom_abline
Example
<- ggplot (worldbankdata, aes (y = Cooking, x= Electricity)) + geom_hline (yintercept = 50 ) + labs (title= "a1: geom_abline only" ) + theme (aspect.ratio = 1 )<- ggplot (worldbankdata, aes (y = Cooking, x= Electricity)) + geom_hline (yintercept = 50 ) + geom_point () + labs (title = "a2: geom_hline \n and geom_point" ) + theme (aspect.ratio = 1 )| a2
Wickham, Hadley. 2016.
Ggplot2: Elegant Graphics for Data Analysis . Springer-Verlag New York.
https://ggplot2.tidyverse.org .
Yu, Youzhi, and Trent Buskirk. 2023.
ggDoubleHeat: A Heatmap-Like Visualization Tool .
https://CRAN.R-project.org/package=ggDoubleHeat .