a1 <- worldbankdata |>
  ggplot(aes(x=Income, y=Electricity)) +
  geom_jitter() + ggtitle("a1: geom_jitter")
a2 <- worldbankdata |>
  ggplot(aes(x=Income, y=Electricity)) +
  geom_point() + ggtitle("a1: geom_point")
a1 | a2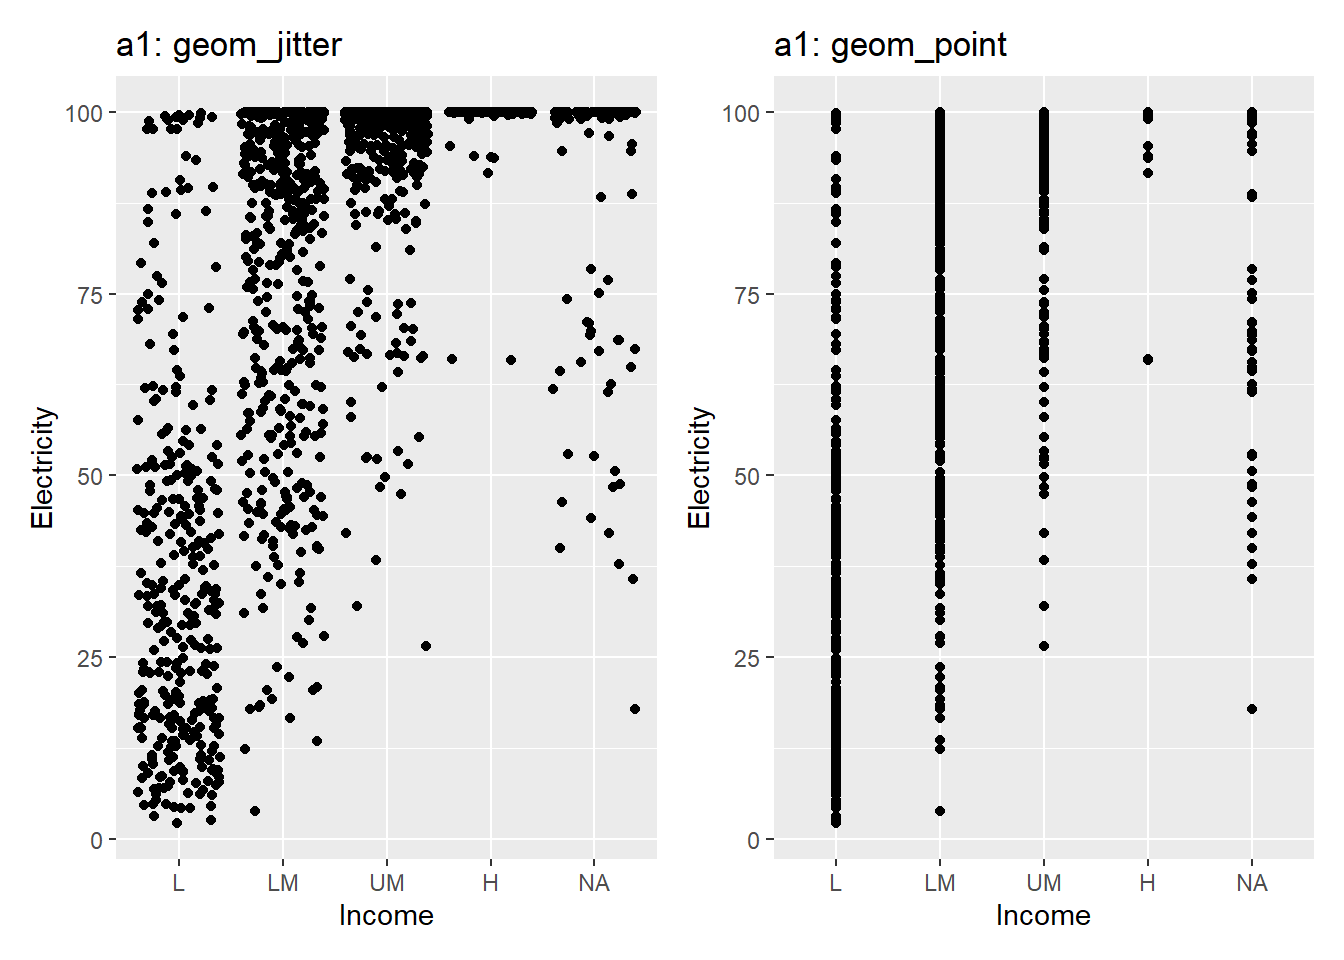
Package
ggplot2 (Wickham 2016)
Description
Adds a small amount of random variation to the location of each point, horizontally and/or vertically.
See also
Example
a1 <- worldbankdata |>
ggplot(aes(x=Income, y=Electricity)) +
geom_jitter() + ggtitle("a1: geom_jitter")
a2 <- worldbankdata |>
ggplot(aes(x=Income, y=Electricity)) +
geom_point() + ggtitle("a1: geom_point")
a1 | a2